Reports exist of dirty electricity from switched mode power supplies in smart electric meters in the Pacific Gas & Electric (PG&E) service area of Northern and Central California (see below). In an effort to try to document the existence of dirty electricity from the brands of smart meters used by electric utilities in Southern California, I conducted a study of over 20 homes in May and June of 2012. The results of that study, along with oscilloscope tracings, are presented below.
Update 9/12/13
In an effort to personally document reports of significantly elevated radio frequency power density levels as well as to personally document the presence of dirty electricity from smart meters in the PG&E service area, I travelled in July 2012 to two towns just north of San Luis Obispo in Central California served by PG&E. (To see photos and information about radio frequency measurements taken at these three homes, click here.)
Here are my oscilloscope tracings of circuits in three homes with Landys+Gyr smart electric meters and one home with a GE analog electric meter in these two towns. Readings were taken on July 29 and July 30, 2012.
A detailed explanation of the equipment and methodology used to obtain these oscilloscope tracings is presented further down on this page.
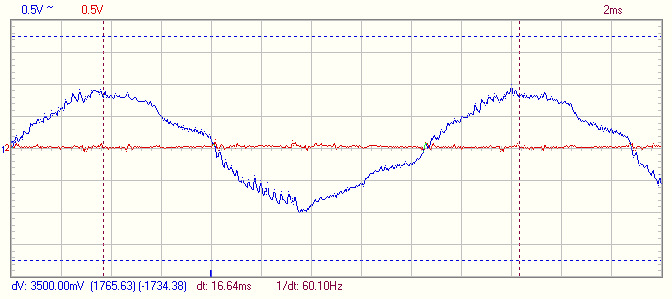
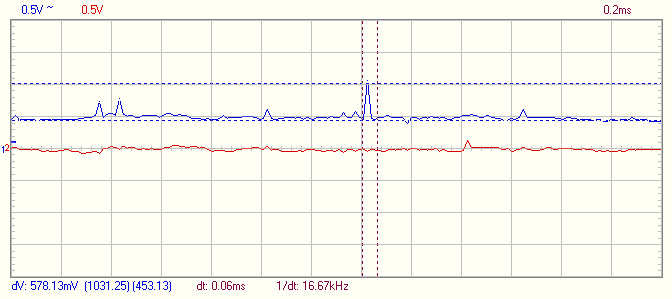
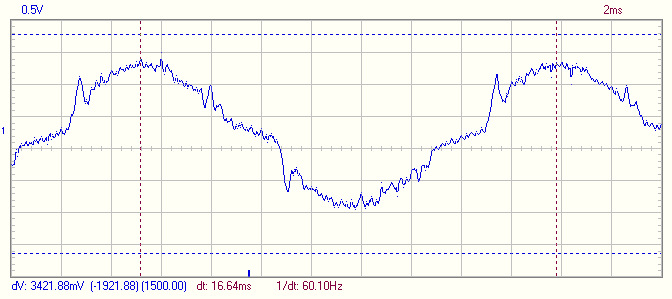
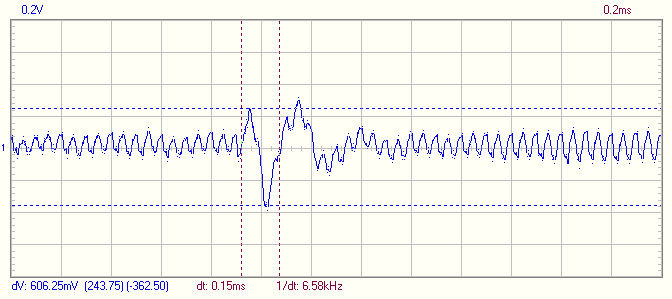
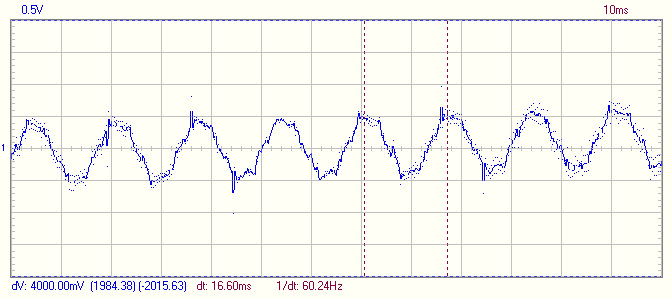
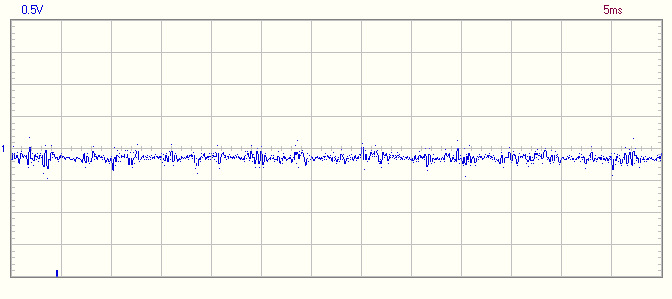
The first tracing shows the oscilloscope tracing at a home with a Landys+Gyr smart meter in Moro Bay taken on July 29th. Dimmer switches, which are a source themselves of dirty electricity, were turned off. Notice the voltage transient on the portion of the sine wave preceding each peak, which may, indeed, be due to the Landys+Gyr smart meter (although I was not able to seek out and isolate other possible sources of dirty electricity in the home):
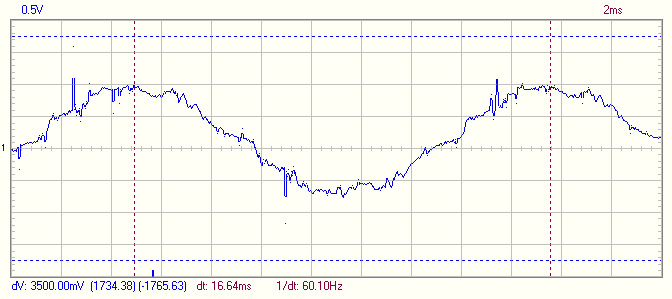
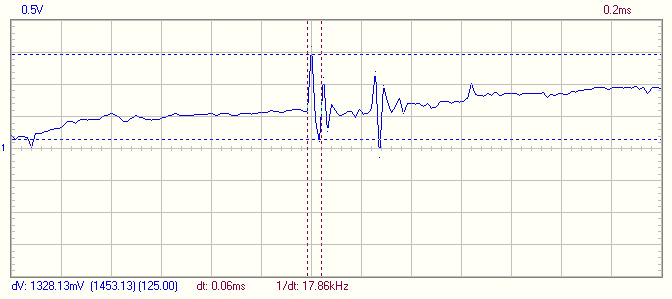
The tracing below is a closeup of the transient, which appears to have a fundamental frequency of 17 kHz and a size of 1.3 Volts in 60 microSeconds, for a slew rate of 21,600 V/Sec:
The next day, on July 30, 2012, I took the following tracings at three homes in Templeton, California, just east of Moro Bay.
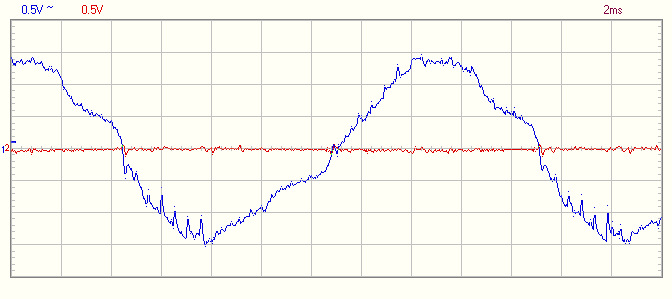
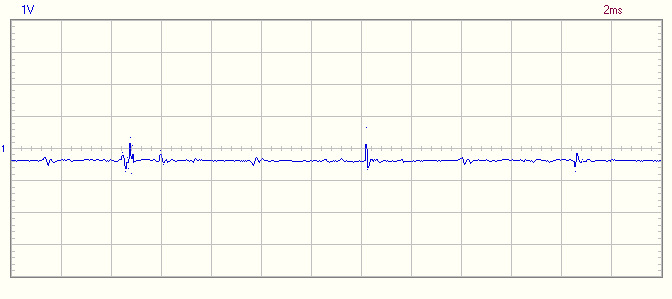
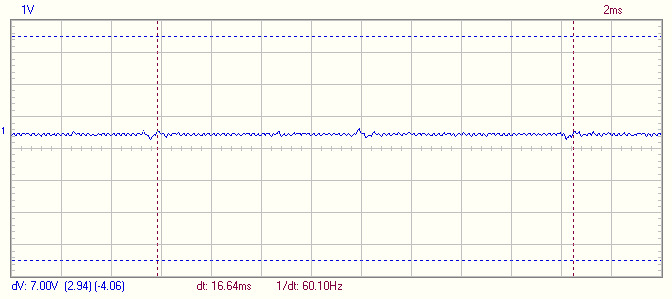
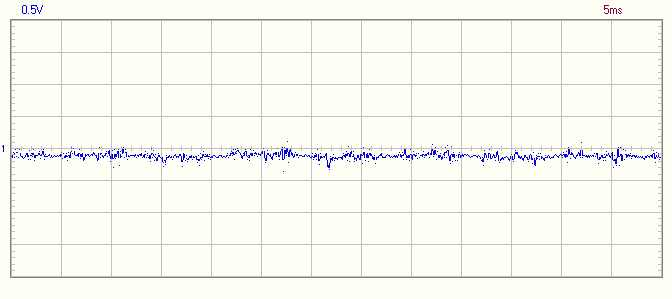
The first tracing was taken at the home of a client who has opted out of the PG&E smart meter program. Her smart meter was replaced with a GE analog electro-mechanical electric meter, which contained no apparent electronic components upon visual inspection. Known sources of dirty electricity within the home, such as dimmer switches and compact fluorescent lamps, were turned off. Notice the lack of any significant voltage tansients on the tracing and the relatively clean wave form:
I then measured circuits powering outdoor outlets at two neighboring houses, both of which had Landys+Gyr smart electric meters, similar to the one measured in Moro Bay the previous day.
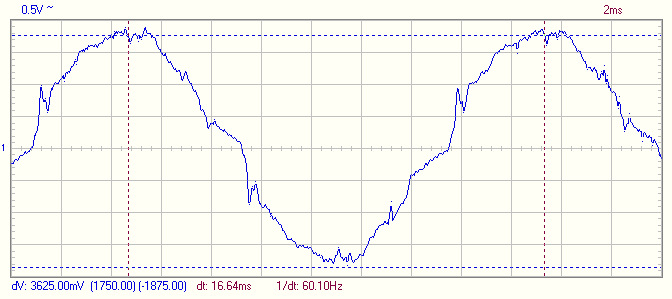
Note that in both cases, there is also a small voltage transient again seen in the accompanying tracing for each house on the portion of the sine wave before each peak:
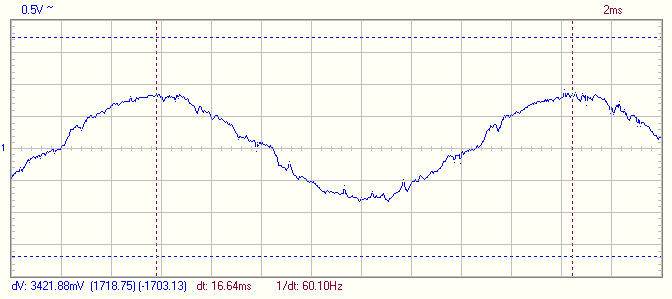
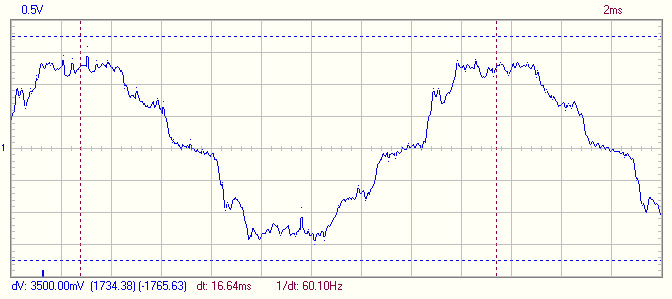
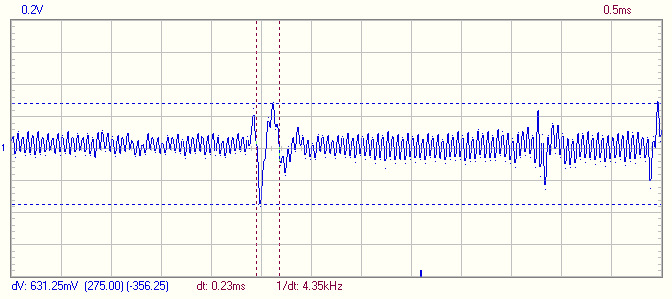
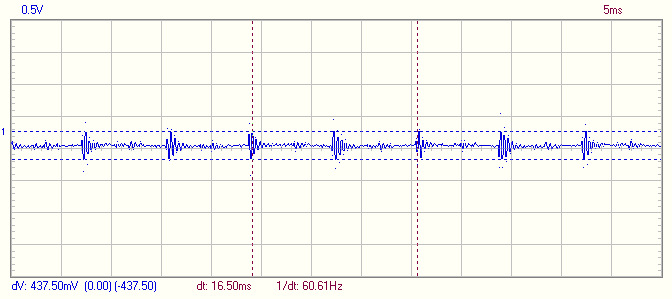
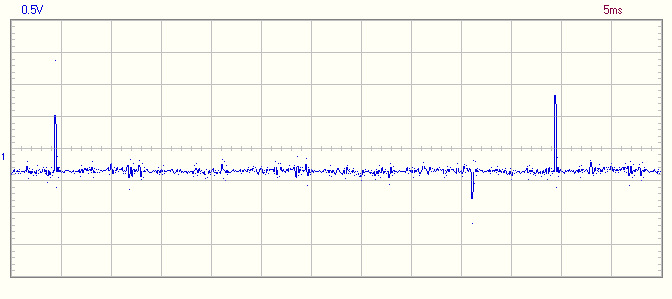
Here is the neighbor’s house to the north:
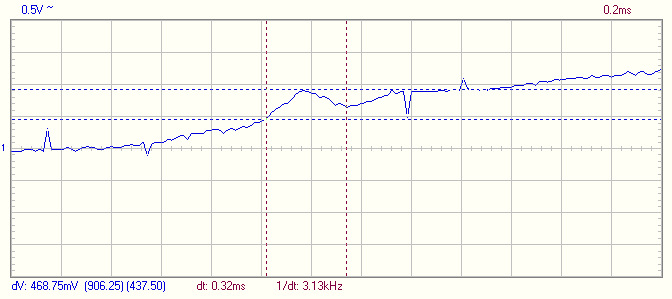
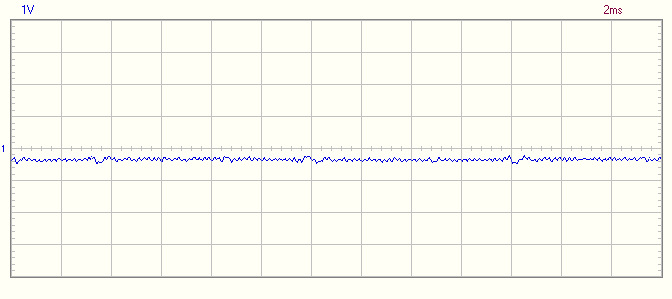
Note below that the fundamental frequency this time is 3 kHz and the height is less than half a Volt (0.47 Volt in 320 microSeconds, for a slew rate of only 1,470 V/sec — see below for the significance of these numbers):
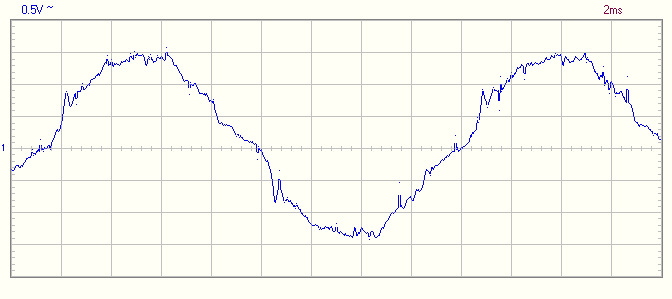
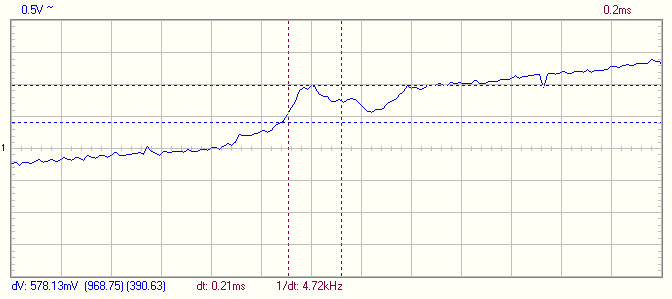
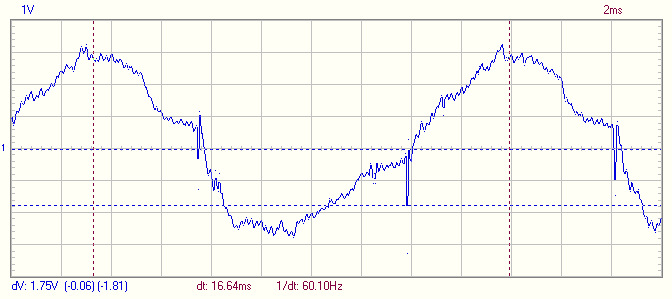
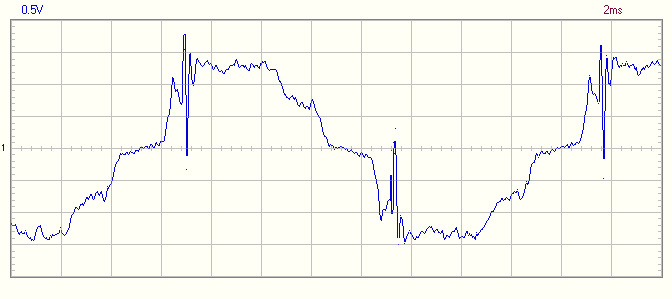
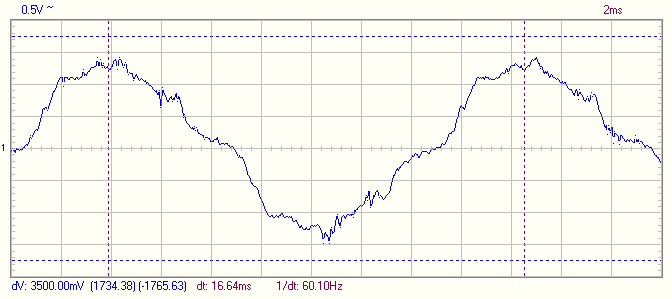
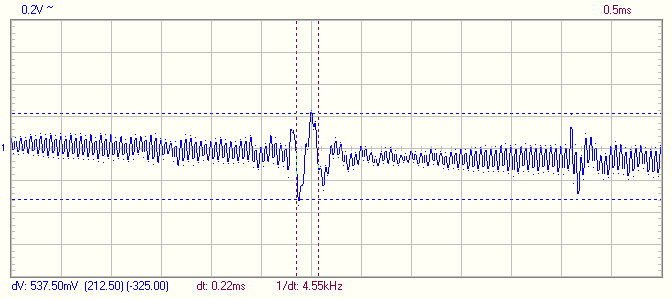
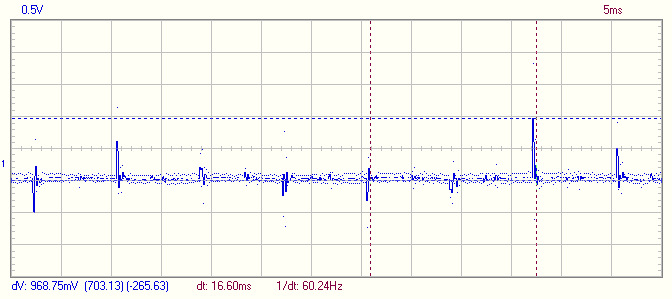
Here is the neighbor’s house to the south:
Note below, again, that the fundamental frequency is 4 kHz and the height is just over half a Volt (0.58 Volt in 210 microSeconds, for a slew rate of only 2,760 V/sec):
Compare these tracings to those reported by engineer Rob States of San Francisco, discussed below, where he reports voltage transients due to reported dirty electricity from a PG&E smart meter of 1.8 Volt in 40 microSeconds, for a slew rate of 45,000 V/sec at a fundamental frequency of 50 kiloHertz.
The tracings in the homes just to the north and south of my client’s house in Central California show smaller voltage transients heights and slower slew rates, 1,470 V/sec and 2,760 V/sec respectively, compared with the 45,000 V/sec slew rate reported by engineer Rob States. The slew rate is a measure of how sharp and fast the rise and fall time is of the transient. This difference may be due to the difference in measuring technique (see below). Rob believes that voltage transients from the smart meters he has measured in Northern California do indeed have a fast rise time, which he speculates may help account for why the dirty electricity that smart meters in his area are reported to be so bothersome for some homeowners. Again, however, I was not able to determine if any other sources of dirty electricity were present in either of those two houses, nor in the house in Moro Bay, which had a tracing that does showed a more moderately sizable voltage transient (21,600 V/sec vs. the 45,000 V/sec reported by Rob).
When you compare the tracings at these three houses in Central California in the PG&E service area, however, to those that I obtained in my study of Itron Openway brand smart meters on homes in Southern California, shown below, you will notice that I do not see any significant evidence of voltage transients that I can attribute exclusively to smart electric meters.
Update 7/28/12: I have asked colleagues in my profession who are engineers and technicians to critique my protocol for the smart meter study I conducted in Southern California in May and June 2012, presented below.
There are reports of harmful harmonic frequency waveform distortions of “dirty power” believed to be caused by smart meter switched mode power supplies in homes in Northern California. These potentially harmful frequencies leak into living spaces from unshielded AC circuits in the walls of homes as well as from plastic AC power cords that we plug into outlets. My smart meter study was conducted to determine if these same harmonic frequencies were present on the electrical wiring of homes with smart meters and other types of digital electric meters in Southern California.
One of my colleagues who is familiar with switched mode power supplies and is proficient in the use of oscilloscopes came up with a modified protocol to overcome a shortcoming he found in my technique. I have hence modified my testing protocol to incorporate his recommendations.
60 Hz Attenuator also Filters up to 10 kHz
This modification was needed because it was pointed out that the Stetzer attenuator I used in my earlier study to filter out 60 Hz frequencies is effective at filtering out 60 Hz when measurements are taken on the circuit into which the Stetzer attenuator is plugged. The problem is, the attenuator also filters out frequencies up to 10,000 Hertz, or 10 KiloHertz (kHz).
Bio-Active, Harmful Frequencies from 60 Hz to 10 kHz Would Have Been Missed
This means that potentially harmful bio-active harmonic frequencies of dirty power in the 60 Hz to 10 kHz range would therefore have been missed. Harmonics at these lower frequencies (below 10 kHz) could have been present in homes of those complaining of sensitivity to smart meters and my previous study method would have missed them. These harmonics, known as “dirty power” or “dirty electricity,” are always multiples of 60 Hz generally ranging from 2-4 kHz all the way up to 100,000 kHz and higher.
An alternate testing method was therefore proposed to bypass the use of the attenuator, thus allowing the oscilloscope to record harmonic frequencies of dirty power from any source at frequencies starting at 60 Hz and extending on up the spectrum.
Proposed Alternative Protocol
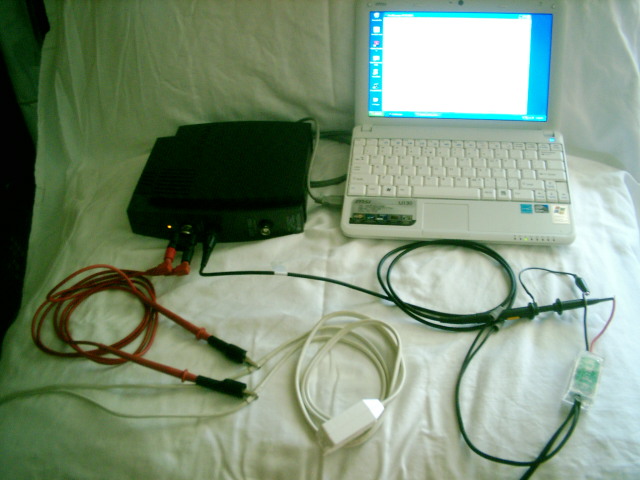
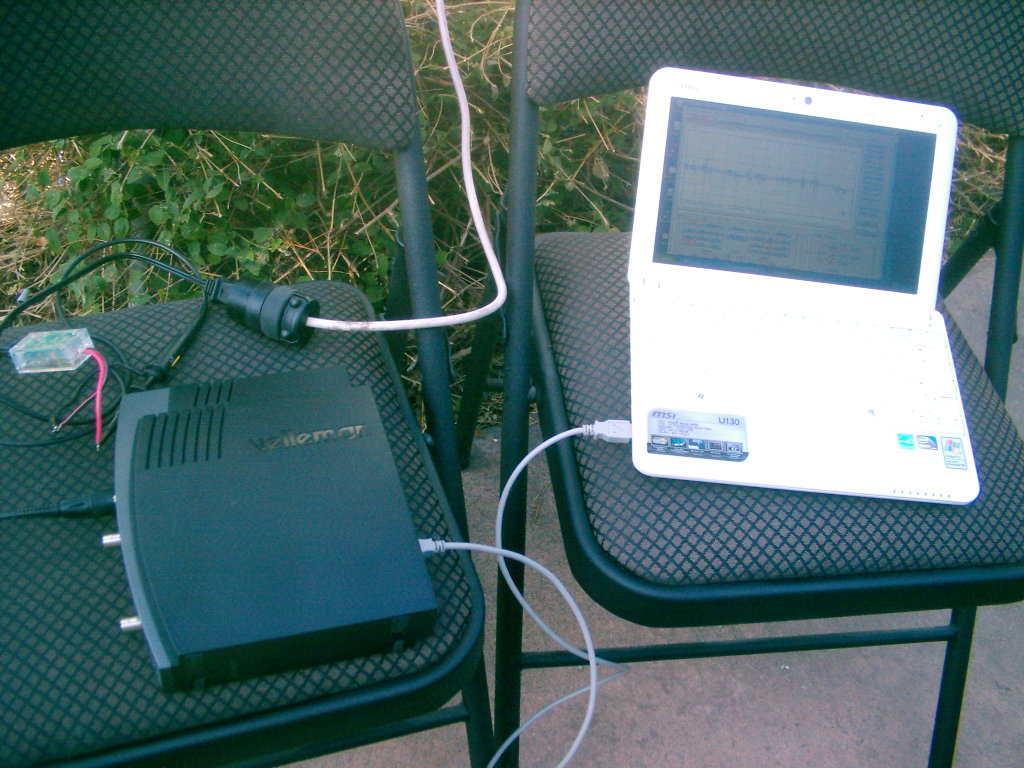
It was proposed that I use a method to measure voltages from a live source without use of the attenuator. Instead it was recommended that I clip input leads from my oscilloscope directly onto the plastic insulation of hot and neutral wires of an extension cord. I then plugged the extension cord into an outlet as close as possible to the smart electric meter being studied. The set up is shown below.
This technique would keep the input voltage flowing into the oscilloscope below the 30 Volt limit, which protects the equipment. It also shows any potentially harmful harmonic waveform distortions at all frequencies from 60 Hz on up (rather than missing those below 10 kHz). Finally, it provides a waveform tracing on my oscillscope that shows a 60 Hz sine waveform so that comparisons can more easily be made between the results I obtain and waveform scans conducted by engineers in other locations around the country, particularly in San Francisco, where smart meters were first deployed in the country and where harmonic frequencies are being detected that are believed to be associated with smart meters used by the local utility.
50 kHz Harmonics Would Have Still Passed Through the Attenuator and Been Displayed in Earlier Study
Before discussing this new technique, it is important to note that regarding my earlier study results, engineer Rob States in San Francisco reported finding consistent harmonics on his oscilloscope from smart meters in the range of “4,000 Hertz, up to 60,000 Hz.” In one case, he found a recurring harmonic that matched the properties of a switched mode power supply with a primary frequency of 50 kiloHertz (kHz). Rob wrote, “At +/- 60 Volts, a spike occurs on each cycle, indicative of a switching power supply.” See below.
Specifically, Rob said in a letter to the California Public Utilities Commission, quoted in the Environmental Options Network blog, “Extensive measurements have demonstrated that all of the meters measured so far, including ABB, GE, and Landis Gyr, emit noise on the customer’s electric wiring in the form of high frequency voltage spikes, typically with an amplitude of 2 volts, but a frequency anywhere from 4,000 Hertz, up to 60,000 Hz. The actual frequency of the phenomena is influenced by the devices that are plugged into the customer’s power. Some houses are much worse than others, and this observation has been confirmed by PG&E installers that have talked to us.”
Rob compiled a report of his measurements at the building mentioned above. As you can see in the first image in Rob’s report measured in that apartment, which you can see by clicking here, there are harmonices present at the top and bottom of each peak of the 60 Hz sine wave of electricity. Rob said in an email exchange, “The spikes come from other SM (smart meters) on the same step down transformer, not from the ABB (the electric meter for that apartment). But those power spikes still appear to be SMPS (switched mode power supply).” Rob measured the fundamental frequency of each spike at 50 kHz, as depicted in the third image in his report.
Compared to Smart Meter Study Results in San Francisco, Earlier Study Results Remain Valid
While it is true that in my study conducted in May and June 2012 I may have therefore missed potentially bio-active harmonics of dirty power that occurred below 10 kHz, it is also true that any harmonic frequencies in the 50 Hz range similar to what was measured in San Francisco would have passed through my attenuator and shown up on my oscilloscope tracings. My building biology colleague agrees with this.
Yet I did not find harmonics of the same size, frequency or waveform in any of the seven homes with smart meters that I studied in May 2012 that I could prove were solely due to the smart meter. Whenever there were harmonics of any frequency above 10 kHz, and there were, they were always found to be caused by a source other than the smart meter, as pointed out in great detail in my earlier report below. The earlier study included five homes with Itron brand smart meters in the Southern California Edison and Glendale Water and Power service areas, and two homes with GE / Trilliant smart meters in the Burbank Water and Power service area.
Updated Study Conducted at Homes in Burbank with GE / Trilliant Brand Digital Meter
A smart meter evaluation using the new technique was conducted at a home in Burbank, California on July 19, 2012. Additional homes were studied on July 24th. The first homeowner is enrolled in the opt out program offered by Burbank Water and Power (BWP), whereby customers of the utility who do not want to be exposed to EMFs from smart meters were offered a digital electric meter but with the communications module removed. That way there would be no radio frequency (RF) transmissions.
Another Potential Source of Illness from Smart Meters Besides Radio Frequencies
However, radio frequencies turned out to not be the only cause of ill health for many customers of PG&E in Northern California. Specifically, customers reported the onset of ill health after smart meters were installed but before the communication module, with its resultant RF, was activated. This led engineers in Northern California to conclude that dirty power produced by switched mode power supplies in smart meters was the source because these engineers saw harmonics on their oscilloscopes.
On the strength of this discovery, customers of PG&E petitioned the California Public Utilities Commission (CPUC) to mandate a non-digital, electromechanical analog meter be installed in homes of all customers who wanted to opt out of the smart meter program. Thus rather than just having a digital meter with the communications module removed, customers of PG&E would have a totally analog meter. Since there are no circuit boards, there is no need for a switched mode power supply. This means that harmonics of dirty power would not be present in these analog meters, providing relief to those customers of PG&E who had become symptomatic from exposure to this form of EMF.
Upon hearing all this, residents of Burbank who were concerned about potential adverse health effects from smart meters wanted the same opt out provision mandated for the regulated utilities in California by the California Public Utilities Commission (CPUC) to also be offered to customers of Burbank Water and Power.
Unfortunately, after much protestation to their City Council by concerned residents of Burbank at numerous public hearings, including one that I attended and spoke at in March 2012, the Council sided with its municipally-owned electric utility and only offered a digital meter without the capacity to broadcast radio frequencies but with a switched mode power supply. There was genuine concern among the citizens that while the radio transmitter was not present, customers would still be exposed to possible harmonics of dirty power from the switched mode power supply that is present in every digital meter.
All Smart Meters Contain a Filter to Block Harmonic Frequencies from its Switched Mode Power Supply, But Not All Filters Are Effective
Tom Wilson, building biologist and Electrical Engineer in Orlando, Florida, told me in an email exchange, “It is true that not all Smart Meter manufacturers cut corners to the point of compromising SMPS (switched mode power supply) performance. In answer to your question, all meters must have a filtering circuit, its just the components they choose to build it and willingness to push or ‘interpret’ the standards (determines how effective the filter will be)…
“In the end it will have to be measured on a situation-by-situation basis because of the variables involved. The harmonics and switching noise pulses coming from a meter in one home may be different in the next home because it is dependent on power factor and is hence load specific. So you may not see smart meter SMPS noise until a pool pump comes on for instance. We still need that simple repeatable protocol based on inexpensive tools.”
Based upon this knowledge that while all smart meters do contain a filter to block the noise caused by the switched mode power supply they contain, but not all filters are effective at doing so, I therefore came to the conclusion that the filters in Landis Gyr and GE smart meters used in the PG&E service area in Northern California and measured by Rob States must not be adequate in blocking harmonics of dirty power that bother some customers there.
I further concluded that other brands of smart meters used by other utilities in other locations have a filter that is effective at blocking these harmonics, at least in the Itron and GE / Trilliant smart meters I measured, because I was consistently unable to find harmonic frequencies above 10 kHz in the seven homes I studied that anywhere matched the size and sharpness (slew rate) of the harmonics reported by engineers in Northern Califoria.
Note 9/12/13: In July 2013, I worked with a client in Thousand Oaks who is an Electrical Engineer, who informed me that he had read that Itron does filter their smart meters. He said he would look up that citation and get back to me, and I await that. I will post that information when I obtain it. This may indeed explain why I have not documented thus far any evidence of dirty electricity explicitly attributable to the Itron Openway smart meters measured in Southern California.
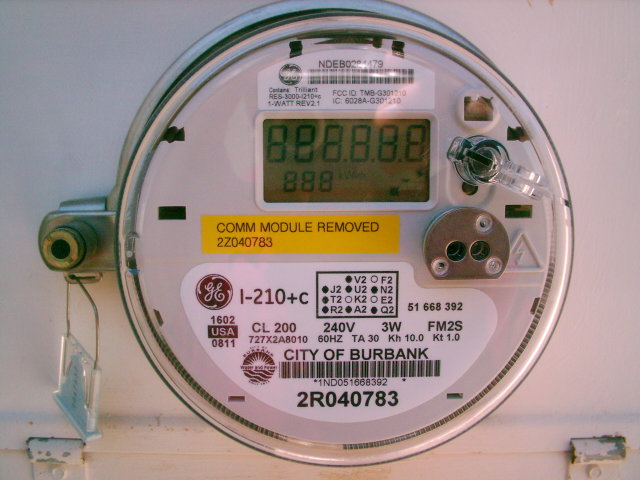
On July 17, 2012, I had the opportunity to study a home with a GE Trilliant brand digital electric meter similar to the GE Trilliant smart meters used in Burbank, however, the communications module had been removed. Additional homes were studied on July 24th and those results are shown below.
The digital non-RF meter studied on July 17th had been installed the very same day just prior to my arrival. See below:
I measured waveform tracings just inside the house opposite this digital meter. I plugged both an extension cord and my attenuator filter used in my previous protocol into an outlet located right below and inside of the digital electric meter.
See the set-up below:
The photo shows the two leads clipped to the outer insulation of an extension cord plugged into the outlet. The two oscilloscope leads are plugged into a Pomona 1296 connector that is attached to the input for channel one (the blue tracings below) on my oscilloscope. The Stetzer attenuator filter is also plugged directly into the outlet, as I had done on my earlier study, and is attached by way of an oscilloscope probe to the input for channel two (the brown tracings below) on my oscilloscope.
Here is a close-up of the twin leads connected to the extension cord (I wrapped white electrician’s tape around the wires of the extension cord so that the clips of the alligator clip would not pierce the insulation and touch the 120 Volt hot wire, which would damage the scope):
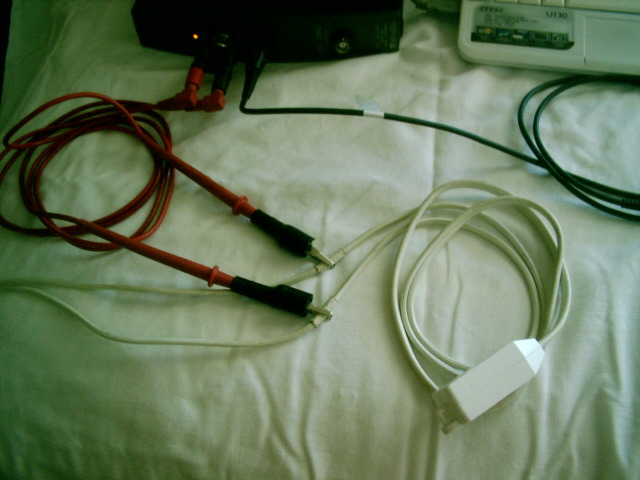
I found that it is important to connect the lead clipped to the hot wire of the extension cord into the red input of the Pomona connector, and that you connect the lead clipped to the neutral wire into the black input of the Pomona connector.
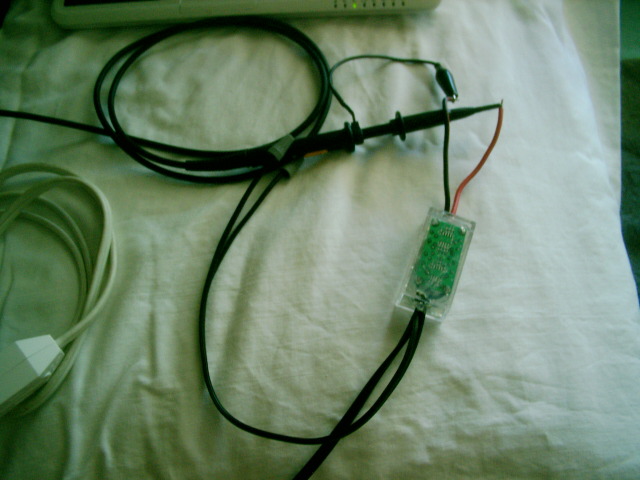
Here is a close-up of the Stetzer attenuator filter set-up. The wire trailing off the bottom of the photo is plugged directly into the outlet, and the hot conductor of the oscilloscope probe is connected to the red wire coming out of the attenuator, and the ground conductor of the oscilloscope probe is clipped to the black wire. The probe is set to 10X and connected to channel two on the scope:
What follows are images of the waveform tracings using the new set up, this time showing the 60 Hz sine wave configuration typical of all AC electricity in North America on the blue tracing of channel one.
The brown tracing is from the same outlet but with the Stetzer attenuator filter in place, showing a flattening of the 60 Hz sine wave. As discussed above, any harmonic frequency of dirty power on the electricity in the outlet with a frequency above approximately 10 kHz will show up on both tracings.
This first image is the initial waveform tracing with all circuits on and loads on in the house:
When I shut off all other circuits except the one that powered the outlet I was plugged into, both waveforms looked a little cleaner (less spikes, less saw-toothed appearance), however you can see that there is still a little roughness or electronic noise in the portion of each cycle leading to a peak, particularly the minus (downward) peak:
That roughness disappears when we unplugged a transformer for a laptop computer (which was off, but the transformer was plugged in) that was plugged into the same outlet as my test equipment:
![]()
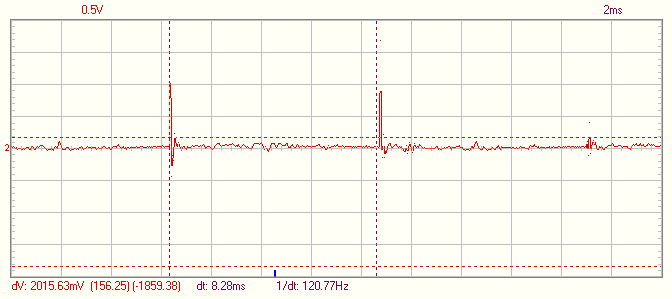
I then asked the homeowner to turn on a dimmer switch in her dining room in which we were sitting, which is a known source of dirty power, and we immediately saw the appearance of the following recurring harmonic distortion or frequency (this image was actually taken on July 24th, and the input from channel two was not present):
Here is the same waveform tracing taken at the same time of channel two by itself, showing the same recurring harmonic from the dimmer switch but without the 60 Hz sine waveform, which was flattened by the Stetzer attenuator:
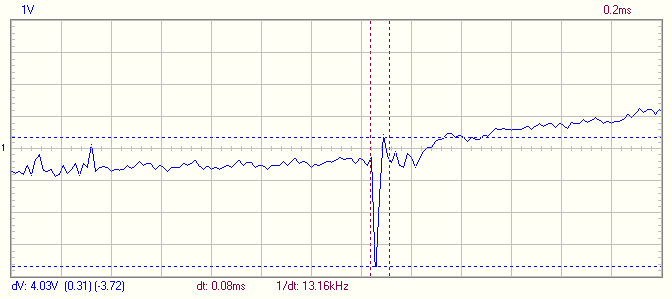
Below is a “close-up” showing the same spike at one-tenth the time frame (0.2 milliSeconds rather than 2ms), to help you see it in more detail. You can see how large and sharp (compact) it is.
This particular harmonic has a height of 4.03 Volts peak to peak, and at 80 microSeconds, a slew rate of 50,375 Volts/Second, exceeding the 1.8 Volt height and 45,000 V/Sec slew rate reported for the harmonic from the smart meter by Rob States in his report (see below).
Here is the recurring spike from the dimmer switch, which again, disappears when the switch is turned all the way off:
This proves that the new testing protocol I am using is capable of showing recurring harmonic waveform distortions when present from a source of dirty power. Once again, here is the same waveform with the dimmer switch turned back off:
![]()
Turing off the dimmer light switch, shutting off all other circuits, and unplugging the laptop transformer results in a relatively clean waveform tracing of electricity from an outlet right below a digital GE / Trilliant smart meter without any large, short, sharp harmonics.
Compare the tracing above to the waveform tracing in the upper right corner of the smart meter report by Rob States in San Francisco, seen here. You will need to open or download this PDF file in order to see the images I refer to in the paragraphs that follow.
Notice in the upper right image that Rob had his oscilloscope set to 500 milliVolts (mV) per vertical square, which is the same as 0.5 Volt (V). He also had his time setting at 2 milliSeconds (ms) along the horizontal axis.
Notice that these are exactly the same settings that I used so that my waveforms would match his in terms of sensitivity and size of any possible harmonics of dirty power. You will see that there are persistent, recurring voltage spikes in Rob’s report in the upper right image at every 60 Hz peak, both high (plus, or “+”) and low (minus, or “-“). Rob says in his fifth paragraph, entitled, “Voltage Extreme,” “At +/-60 Volts, a spike occurs on each cycle, indicative of a swithing power supply.”
As you will notice in the third image on the right of Rob’s report, he has isolated the largest spike seen in the first image. In the text he says, “The spike has a fundamental frequency of 50 KHz, and a voltage transient of 1.8V (almost four boxes tall from low peak to high peak) in 40us (microSeconds), for a slew of 45,000 V/Sec (Volts per second).” The slew is the quickness with which the spike rises and falls, and is the reason why some people are so bothered by these harmonics of dirty power. That is the consensus among other EMF experts. The faster the slew, meaning the sharper the harmonic waveform, the more symptomatic people are likely to become.
Compare that height of 1.8 Volts and fast slew of 45,000 V/sec on Rob’s study to the tracings shown above (with the dimmer off), where there are no such spikes or recurring harmonics.
In fact, I analyzed the only “spike” I could find at the top and bottom of each peak in any tracing with the dimmer switch off, and came up with the following waveform tracing:
In this tracing, I changed the time setting from 2 milliSeconds (ms) per box to 0.2 milliSeconds, meaning each box measures one-tenth the time of the previous tracing. 0.2 milliSeconds (ms) is the same as 200 microSeconds (us), which is the same setting that Rob used in his third image where he isolates the large, short, sharp recurring spike that he believes causes everyone such problems with the smart meters used by PG&E. I set the time setting on my tracing at 0.2 ms, which is the same as Rob’s 200us.
Notice that in my tracing, the one harmonic that I did isolate has a voltage height of only 578 milliVolts, or half a Volt, compared to Rob’s harmonic spike of almost 2 Volts high. That means the harmonic I saw was one fourth the size of the harmonic he measured.
With a time of 60 microSeconds, the slew rate of the harmonic I saw was only 9,633 Volts/second, which is five times slower and less sharp, than the 45,000 V/Sec slew rate that Rob reported, and presumably, a lot less symptom-inducing.
Thus this recurring harmonic was one-fourth as strong as the harmonic reported in San Francisco, and one fifth as sharp.
Furthermore, we cannot even be sure that this harmonic is due to the GE / Trilliant digital smart meter in the first place, because I measured a similar harmonic on the waveform tracing taken at this same house on May 17, 2012, two months before the digital smart meter was installed.
The tracing taken on May 17th shows this same harmonic:
The timing of the tracing is the same as the tracings taken on July 19th, that is, 2 milliSeconds, but the voltage height of each box in the May study was 1 Volt, rather than 0.5 Volt. That would mean the harmonics would appear somewhat smaller in the previous study.
In spite of this, you can still see the presence of repeating harmonics occurring at roughly each +/- 60 Volt peak. Notice that like the harmonics in the newer tracing with a height of 0.578 Volts, these harmonics were a little less than half a box high, meaning their size is roughly 0.4 Volts, similar to the size of the harmonics seen on July 17, 2012.
Thus it is clear that the harmonics shown in the previous tracings on July 19, 2012 were likely present before installation of the GE digital meter and are therefore from some other source.
Comparable Data from other Homes in Burbank
I returned to Burbank on July 24, 2012 and studied several more homes that each have the new GE digital meter with the communication module removed as part of the Burbank Water and Power opt out program. The results are displayed below.
I also returned to a home in Burbank I had evaluated previously on May 17 and May 22, 2012 that has a GE / Trilliant smart meter with the communication module intact to re-evaluate it using the new protocol. The waveform from that house is shown below:
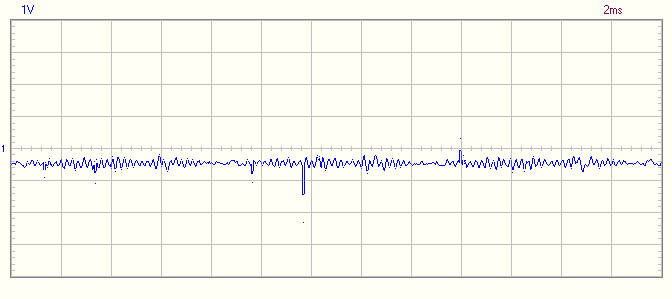
To once again demonstrate that the new protocol does demonstrate voltage harmonics when present, the following tracing shows the same circuit but this time with a dimmer switch turned on in an adjacent room. Notice the large, short, sharp repeating harmonics just before the height of each peak that measure almost 2 Volts high (almost four vertical squares at half a Volt per square).
I had seen these harmonics before in this house in the previous study and they are also present on the waveform tracings using the new protocol. They disappear when the dimmer switch is turned off, and are therefore not from the GE smart meter.
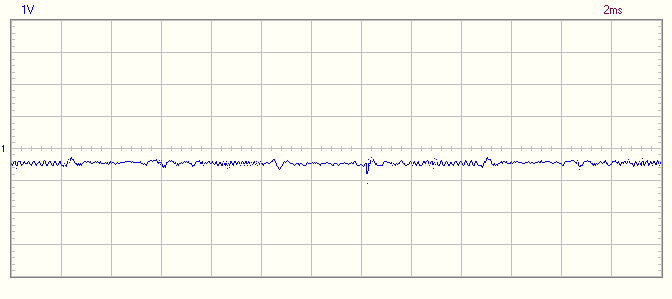
In another home with a new GE digital meter with the communications module removed, the following tracing also shows a recurring harmonic just before each peak, even with dimmers turned off in the house:
This could be assumed to be from the smart meter, however, the harmonic is not short or sharp with a fast slew rate like the harmonic shown in Rob States’ image.
Also, the following tracing, taken the same day (July 24th), which was after installation of the GE RF-off digital meter, but this time using the old protocol with the Stetzer attenuator, looks identical to a tracing taken on May 17, 2012, prior to installation of the new digital meter.
The first tracing below was taken on July 24th and the one below it was taken in May, before the new GE digital RF-off meter was installed. Notice that the settings are the same (1 Volt, 2 milliSeconds). They are almost identical:
There appears to be no evidence of any new harmonics once the new opt out GE meter was installed that are not also present in the tracing taken before it was installed.
A third home with the new GE digital RF-off meter had the following tracing:
Again, there is no evidence of significant harmonic frequencies on the waveform tracing with the presence of the new digital meter.
Preliminary Conclusions and Future Plans
Here are my preliminary conclusions on the findings thus far:
- Based upon the findings presented above, the GE / Trilliant model digital electric meters installed by Burbank Water and Power as part of their opt out program do not appear to generate harmonics of dirty power similar to those reported from smart meters used by PG&E in Northern California in the 50kHz range.
- The same can be said about the Itron Openway brand smart meters used by Southern California Edison and Glendale Water and Power.
- Both of my studies showed that whenever large, short and sharp harmonic waveforms appeared on the tracings, they could always be eliminated by switching off some other source in the house, such as a dimmer switch or a lamp with a touch switch, or in the case of the home in Orange, they persisted even with removal by an electrician of the Itron smart meter itself (and were thus from a source outside the house).
- Other recurring harmonics that could not be traced to a source in the house were always short in voltage, long in time and slow in rise time, or slew, as compared to the high (strong), short and sharp recurring harmonic waveforms reported from smart meters in Northern California.
- In order to corroborate these findings, I am asking my colleagues in the building biology profession who are engineers and technicians to critique these findings and the conclusions I have come to for accuracy and correctness.
- We will also open the review of these findings to those throughout the US and Canada who are outside our profession for their input. I had feedback from non-building biology engineers when I released my first study (below) in June 2012.
- If any of the small, wide and slow recurring harmonic waveforms detected in either of my smart meter studies are indeed caused by digital RF-off and smart meters, then we need to ask how bio-active they are even if they are only half a volt in size and have a slew rate of only 9-10,000 Volts/Second.
- How impactful is the fact, reported by both Tom Wilson of Orlando and Rob States of San Francisco, that harmonics of dirty power are load dependent, that they differ from house to house (“some houses are much worse than others,” according to Rob), and they may not show up “until a pool pump comes on,” as Tom says. However, if they were so elusive, Rob gives the impression that they are quite prevalent and easy to find when he says, “Extensive measurements have demonstrated that all of the meters measured so far… emit noise on the customer’s electric wiring in the form of high frequency voltage spikes…” Yet, I have not found one example of harmonics that are anything like the voltage size or slew rate that Rob reports that could not be attributed to some other cause.
- The difficulty with trying to document that harmonics of dirty power are specifically caused by one source is that it is almost impossible to exclude other sources of a recurring harmonics from your study. There is always the nagging question, “Is the harmonic I am seeing from the smart meter or some other source?”
- For that reason, Tom Wilson has proposed that the building profession purchase several current generation smart meters used by utilities around the country and do our own bench testing. We need to determine how effectively the filters that smart meters already contain block the harmonics produced by the switched mode power supply each meter contains.
- We would, of course, have to isolate and filter the 120/240 Volts of electricity at the bench used to power the smart meter being tested so that the incoming power is clean. That way, any harmonics that are noted on the 60 Hz sine wave coming out of the smart meter would be solely from that smart meter and not from the incoming power. We are organizing such a study.
In the meantime, I/we plan to conduct the following steps:
- Continue to evaluate homes in Burbank, Glendale, and Orange County that I previously studied and reported upon and repeat my measurements using the new measuring protocol.
- Evaluate smart meters in homes in Southern California not previously studied.
- Evaluate several homes in the PG&E service area that have GE smart meters, which I will be able to do this coming week. I will also be able to measure an electromechanical analog meter that PG&E has installed as part of their opt out program. These will be the same GE models that have been evaluated in San Francisco.
- Building bioligy colleagues both here in Southern California and around the US and Canada will conduct similar oscilloscope testing of smart meters on homes in their local area using this new protocol.
- Invite engineers outside the building biology profession to conduct smart meter tests of their own to determine the degree to which filters in smart meters used in their area effectively block harmonic frequencies.
- Conduct bench tests of smart meters by a team of building biology engineers and technicians to isolate out other sources of dirty power.
- Encourage engineers outside the building biology profession to likewise conduct bench tests of smart meters.
Introduction to Original Study (June 21, 2012)
There are reports, particularly from Northern California, of people falling ill to the presence of so-called “dirty power” voltage harmonics known to be caused by the switched mode power supply (SMPS) in smart meters used by their local electric utility, Pacific Gas and Electric (PG&E). PG&E uses Landis Gyr and GE brand smart meters. This is in addition to the ill effects also reported from exposure to radio frequencies broadcast by these smart meters.
In an effort to confirm that these same voltage harmonics were also present on circuits in homes here in Southern California, I measured voltage waveforms in more than 25 homes with and without smart meters using an oscilloscope and spectrum analyzer. The electric utilities in this part of the state use Itron and GE / Trilliant brand smart electric meters. I started out trying to measure this dirty power from smart meters, assuming it was universal and was also happening here, to advise my clients on how to mitigate it. This was before we knew whether we would have an opt out option or not. Then I discovered I couldn’t find any harmonics that I could confirm were from the smart meters in one house after another.
After finding voltage harmonics in several homes similar to those reported in Northern California, but always discovering they were from known sources of dirty power other than the smart meter (dimmer switch, touch lamp) and seeing them disappear when those sources were shut off, I reported on June 4, 2012 that one home in particular in the city of Orange had what I thought was voltage harmonics coming solely from its Itron brand smart meter. I had carefully isolated my study to only one circuit and I had unplugged appliances from the only other outlet on that circuit, as I had done in the other homes where I did see harmonics on the waveform tracing. The voltage harmonics in this house in Orange, which matched the criteria for a switched mode power supply and which resembled those harmonics reported in Northern California, could then only come, I thought, from the Itron smart meter or from outside the home (see below).
I returned to that home with a team of colleagues on June 8, 2012. Repeat analysis showed the continued presence of voltage harmonics, albeit somewhat smaller in voltage strength compared to one week earlier. This time, however, because of the serrendipitous presence of a licensed electrician, I was able to re-measure the circuit with the Itron smart meter temporarily removed and with jumper wires in place connecting the clips in the meter base. This showed the voltage harmonics to still be present.
My preliminary conclusion was that the voltage harmonics must therefore be from a source outside that house, and not from the Itron smart meter. Waveform tracing images and photos taken before and after the smart meter removal are shown below.
Details of the Study
This smart meter study is conducted by Oram Miller, BBEC, Certified Building Biology Environmental Consultant. I am not an engineer nor an electrician, however I, like my BBEC colleagues, have been trained by engineers and electricians. I confer with engineers in reviewing my measuring technique. I have also used my oscilloscope alongside two other oscilloscopes operated by engineers and my oscilloscope shows the same waveform tracings and spectrum analysis seen on the other scopes.
Some of the data displayed below was obtained in the presence of engineers who participated in this study. Specifics about the instruments used are given below.
The homes studied are in the service areas of the following electric utility companies, along with the brand of smart meter used (homes with analog and older digital electric meters were also measured):
- Southern California Edison (SCE), using Itron Openway smart meters
- San Diego Gas and Electric (SDG&E), also using Itron Openway smart meters
- Glendale Water and Power (GWP), also using Itron Openway smart meters
- Burbank Water and Power (BWP), using GE/Trilliant smart meters
Some of the homeowners in homes studied in Glendale and Burbank are on a delay list, meaning they still have their original analog meters but will soon have digital RF-off smart meters installed. This is already starting to happen in Glendale as of the second week of June 2012.
Additionally, homeowners living in those homes studied in the Edison service area that all have Itron smart meters will soon have them replaced with analog meters as part of that company’s opt out plan.
These two actions will provide a comparison of several homes before and after digital meter installation, and before and after smart meter removal. In fact, a variation on this comparison was already accomplished on June 8, 2012 at the home in Orange discussed above when an electrician temporarily removed the Itron smart meter, allowing on-the-spot “after” measurements. See below for details.
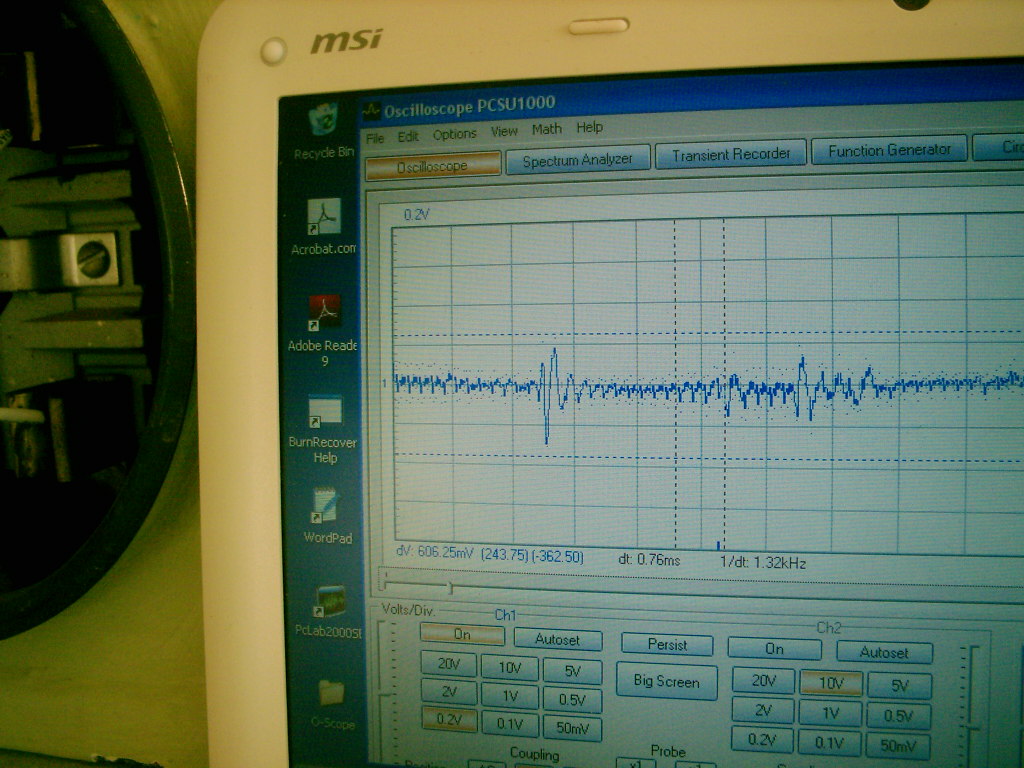
Instruments and Protocol Used (Prior to 7/17/12)
I use a Velleman PCSU 1000 Two-channel USB PC Oscilloscope and Spectrum Analyzer plugged into a PC notebook computer. I purchased the oscilloscope from LessEMF ($399, Catalogue #F466-2). I use a 4-stage RC attenuator/filter to filter out 60 Hz and reduce the input voltage below the maximum allowed for the oscilloscope of 30 Volts, purchased from Stetzer Electric for $50 (although I modified my protocol and now also measure without this attenuator).
My protocol is as follows: My initial readings are taken with all circuits on and normal loads on in the house. This is done because engineers report that voltage harmonics from smart meters are load-dependent and vary depending upon what else is on in the house (see below) and I want to simulate normal living conditions.
If I do not see harmonics, I record my measurements at that time and move on. If I do see harmonics, I then take every effort to rule out other appliances and electronic devices in the home under study as the source of the harmonics by first looking for and shutting off known sources of dirty power, such as dimmer switches and fluorescent lamps.
If the harmonics are still there, I will further isolate the source by shutting off every circuit except the one that my oscilloscope is plugged into and making sure nothing else is plugged into any other outlet on that circuit. I also always take readings with my laptop computer unplugged and in battery mode to eliminate voltage harmonics from the laptop transformer (which does produce artifacts). The Velleman scope gets its power from the PC through the USB cable and does not have its own power supply.
For example, artifacts were found in two homes, the first one from a touch lamp, which is turned on and off by a touch of the finger, and the second from dimmer switches. Both devices caused large harmonics on the oscilloscope with fast rise times, and therefore, high voltage slews, that mimicked the voltage harmonics reported from smart meters in San Francisco. The harmonics that I found, which were originally thought to be from the smart meter in each house being studied, disappeared when the lamp and dimmer switch were turned off.
History of Voltage harmonics in Homes from Smart Meters in Northern California and North America
There are reports by engineer Rob States and colleagues in San Francisco, as well as by others throughout North America, of voltage harmonics measured with oscilloscopes on circuits in homes with smart meters. These harmonics are believed to be caused by the switched mode power supply (SMPS). Even if a homeowner opts out of the smart meter program, which is now possible in the PG&E service area, and either keeps their original analog meter or gets their smart meter replaced with an analog one, these harmonics are still seen on an oscilloscope riding in on the utility 60 Hz power from smart meters on neighboring homes.
These voltage harmonics are seen in many homes, particularly in the PG&E service area. See Rob’s letter to the California Public Utilities Commision (CPUC), quoted in the Environmental Options Network blog here, in which he writes, “Extensive measurements have demonstrated that all of the meters measured so far, including ABB, GE, and Landis Gyr, emit noise on the customer’s electric wiring in the form of high frequency voltage harmonics, typically with an amplitude of 2 volts, but a frequency any ware (sic) from 4,000 Hertz, up to 60,000 Hz. The actual frequency of the phenomena is influenced by the devices that are plugged into the customer’s power. Some houses are much worse than others, and this observation has been confirmed by PG&E installers that have talked to us.”
Rob also discussed this with Dr. Bill Deagle of San Diego in their thirty-minute Internet radio interview recorded on October 13, 2011 and accessed here. Rob says, “Now, I’ve done over a couple hundred hours of field measurements watching these harmonics and figuring out what the deal is. (In a separate email, Rob said, ‘Between me and my collaborator, we did… about 12 or so site visits.’)
Rob continues: “They (the voltage harmonics) change based on what’s on in the house. They seem to move around. It’s a very tricky, unresearched area. Because these things surround you, the inside of your house is suddenly 24/7…, there’s 120 of these every second. There’s one on the positive power, there’s one on the negative power.”
The slew is the rise and fall time of a voltage spike. The higher and faster the voltage spike rises and falls, the more symptomatic electrically-sensitive individuals appear to become. This is independent of and in addition to the radio frequencies sent out by the home area network transmitter within each smart meter.
In his interview, Rob says, “I have a collaborator who has a Ph.D. in Electrical Engineering from Stanford. I asked him about this and he said, ‘Switching mode power supplies are more efficient when they have faster rise time.’ Rise time meaning, the 70,000 volts per second. The engineers (at the smart meter manufacturing company) that designed this (switched mode power supply) thought they were doing a good job. They were doing an efficient power supply.”
Some Engineers Claim Not All Smart Meters Emit Harmful Voltage harmonics
In an email exchange between Oram and fellow building biologist Tom Wilson of Orlando, Florida, who is also an Electrical Engineer and who previously designed and installed smart meter networks, I asked Tom to comment on a statement he made that some smart meter manufacturers adequately filter the noise created by their product’s switched mode power supply (SMPS). Tom writes, “It is true that not all Smart Meter manufacturers cut corners to the point of compromising SMPS performance. In answer to your question, all meters must have a filtering circuit, its just the components they choose to build it and willingness to push or ‘interpret’ the standards (determines how effective the filter is)…
“In the end it will have to be measured on a situation-by-situation basis because of the variables involved. The harmonics and switching noise pulses coming from a meter in one home may be different in the next home because it is dependent on power factor and is hence load specific. So you may not see smart meter SMPS noise until a pool pump comes on for instance. We still need that simple repeatable protocol based on inexpensive tools.”
Measuring for Voltage harmonics in Homes in Southern California — Are they from a Smart Meter?
I have measured circuits in seven homes thus far in Southern Calfornia with present generation Itron Openway and Trilliant brand smart meters to try to document the same voltage harmonics found in Northern California in an effort to determine why certain individuals are so symptomatic when a smart meter is installed on their home. (The remainder of the homes studied have their original analog meters or older generation digital meters.)
The results of my survey are that I found voltage harmonics in several homes that match the description given by Rob, but in each case it turned out that the harmonics came from another known source of dirty power. All evaluations in homes with Itron and Trilliant smart meters, with the exception of one home in the city of Orange, show only mild or no voltage harmonics with low voltage slews, if any, when known sources of voltage harmonics were turned off. Images are shown below.
The latest home measured, located in Orange in the SCE service area and with an Itron Openway smart meter, was originally assessed on June 2, 2012. I reported the following on June 4, 2012: “The results of my survey are that I found voltage harmonics that match the description given by Rob in only one home, so far… The harmonics were found on three circuits throughout the house, including, and strongest at, an outlet below the main breaker panel, where the smart meter is located. These harmonics occur 120 times per second. All other potential sources of voltage harmonics were unplugged or turned off. The house has no dimmer switches. In each case, I also shut off all breakers except the one I was measuring, and I unplugged all appliances on that circuit, and yet, the voltage harmonics remained. The homeowner reported that symptoms of EMF sensitivity developed within one to two weeks of installation of her smart meter in September of 2011. This included skin rashes and swollen eyes.”
I returned to this house on June 8, 2012 with a fellow building biologist and engineer, Peter Sierck of Encinitas, California and a retired physicist and client from Tustin, whose home we also evaluated, to re-study the voltage harmonics. The voltage harmonics were still present under the conditions discussed above, although somewhat smaller in size.
The most important development is that after Peter and the physicist left, I spoke with a licensed electrician invited by the homeowner to come and assess how to implement the recommendations I had made on my previous visit to mitigate her electricomagnetic-related symptoms caused by other types of EMFs found in the house.
When I explained to him that I would be returning to re-measure the circuits for voltage harmonics after Edison replaced her smart meter with an analog one, to my surprise he offered to pull the Itron smart meter out of its socket and jump the clips temporarily, which he said he was authorized to do, so I could re-test the circuits on the spot.
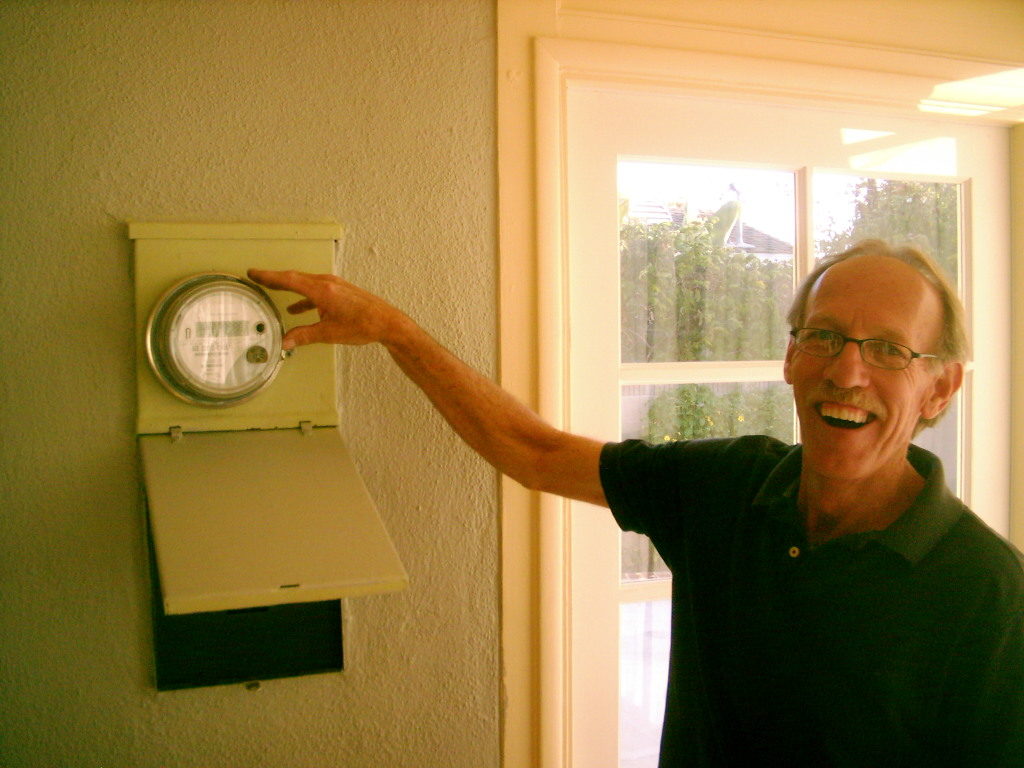
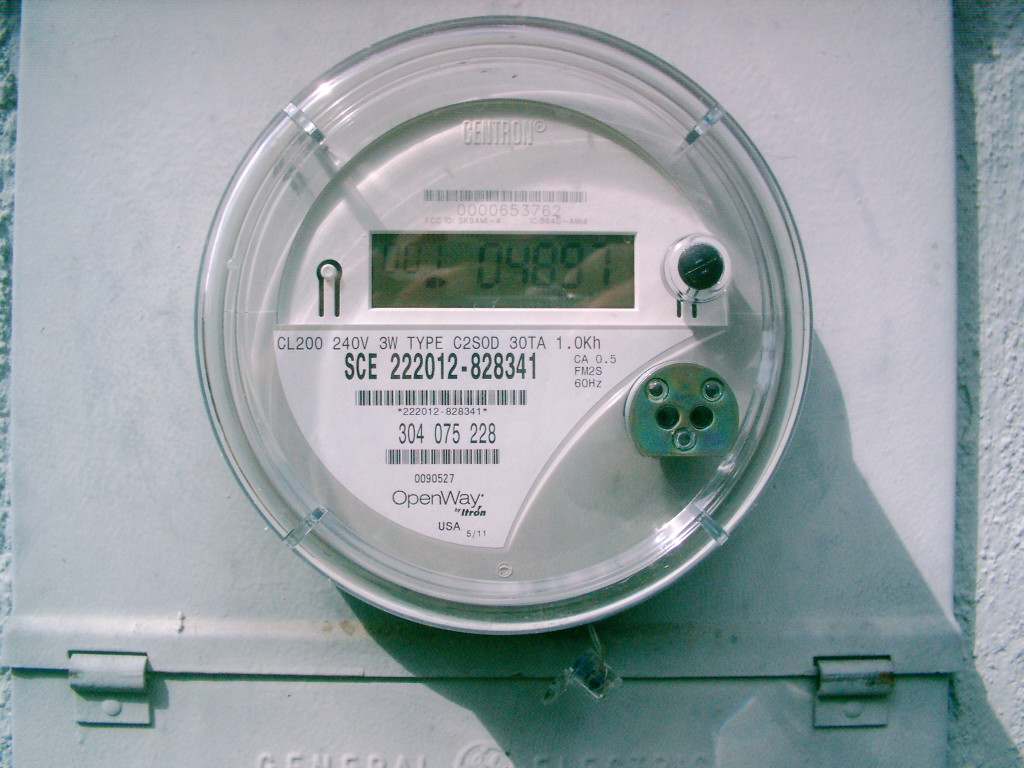
Here is electrician Gordon Bloem with the Itron smart meter in place:
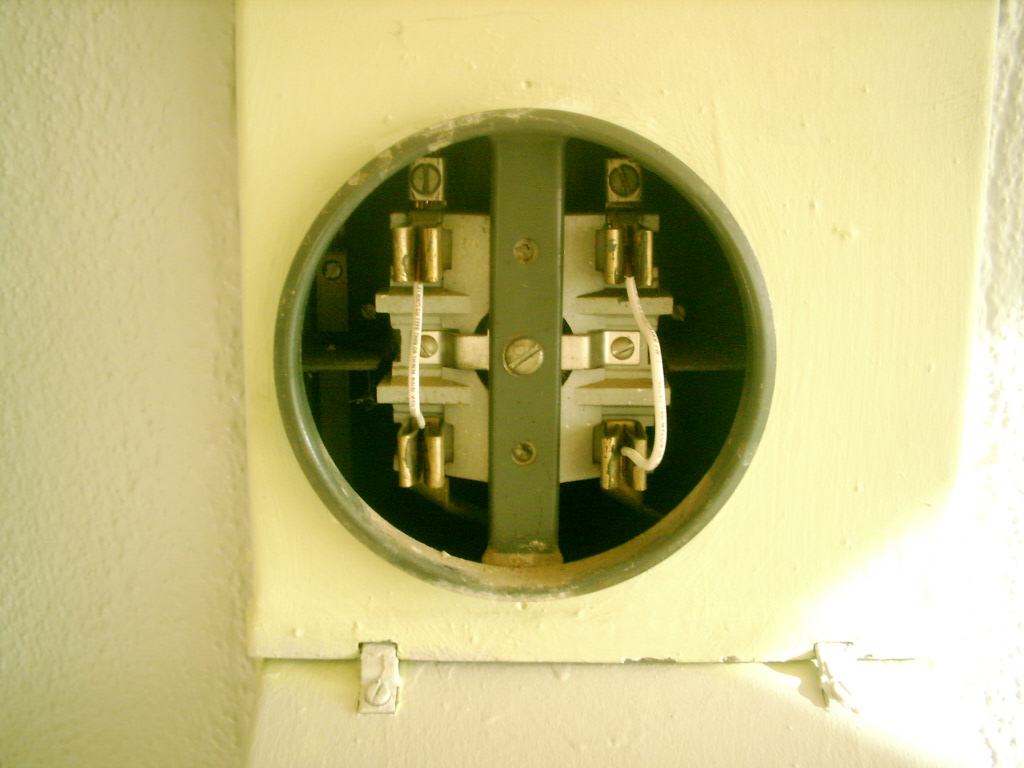
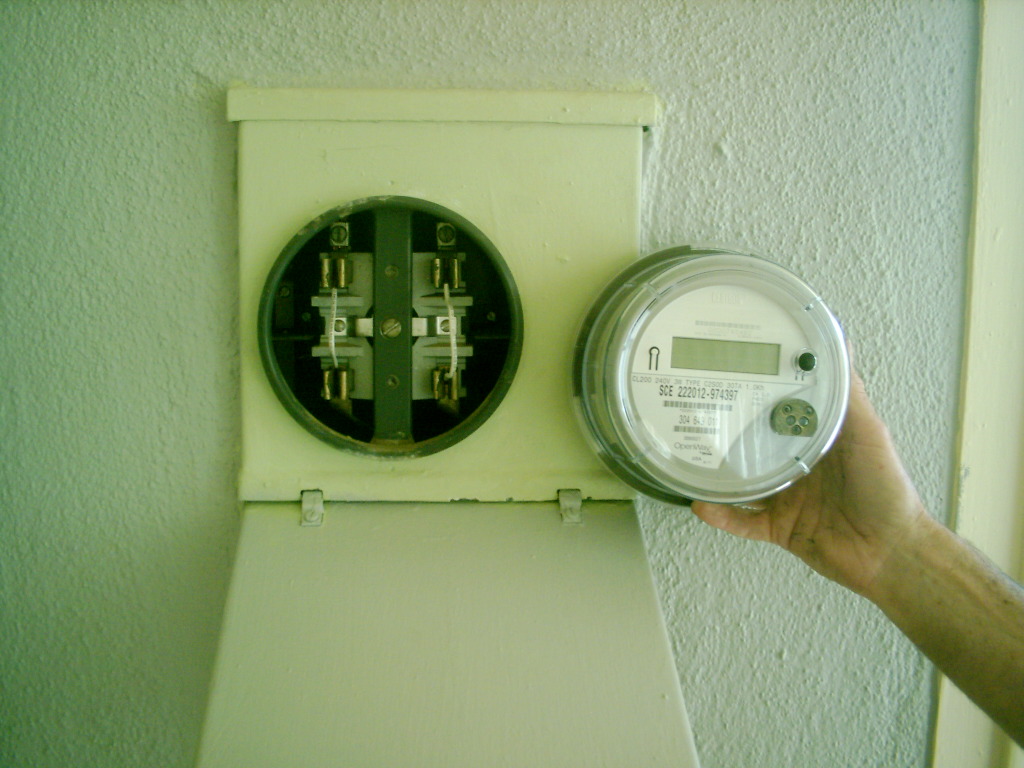
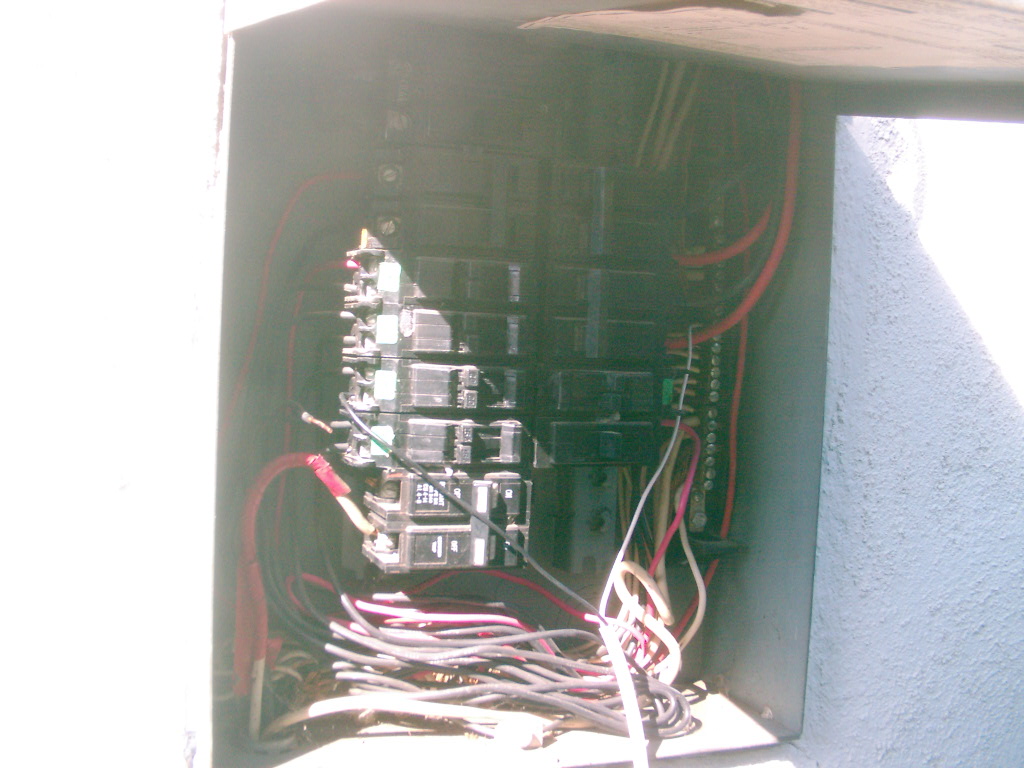
Next, Gordon removed the smart meter and inserted wires to jump the clips so that electric power could continue to come in from the utility, without the smart meter in place:
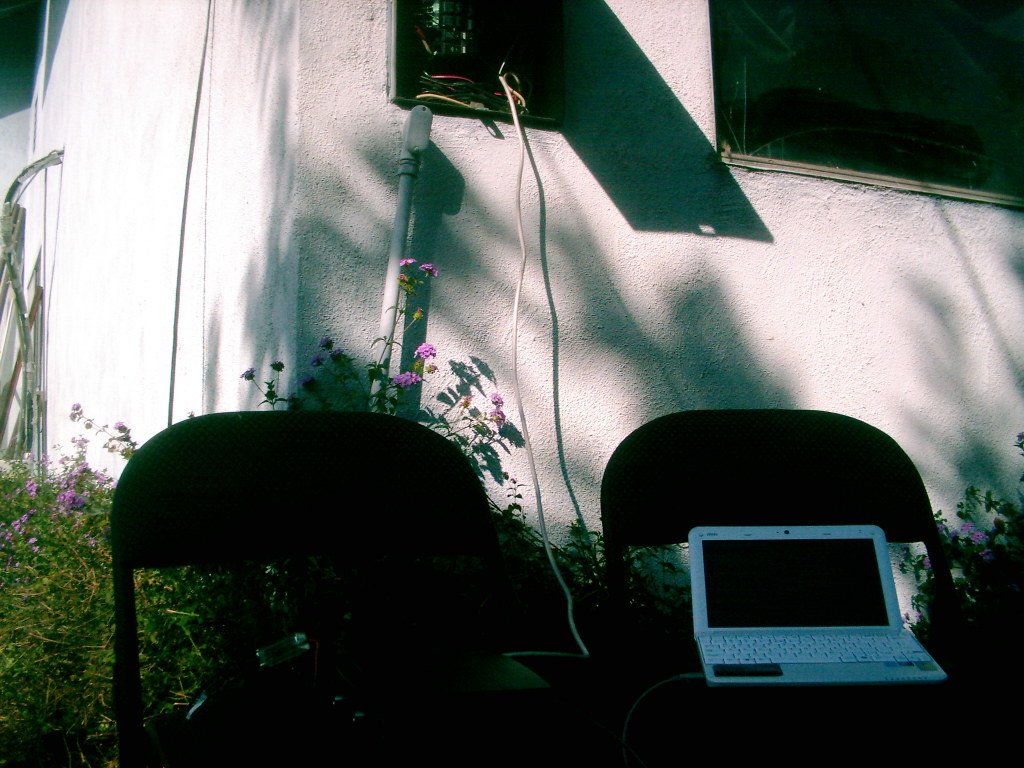
Here is the set-up showing the oscilloscope on the left and the laptop on the right, plugged into an outlet beneath the panel. That outlet was powered by the only circuit breaker switched on and nothing else was plugged into the only other outlet on that circuit:
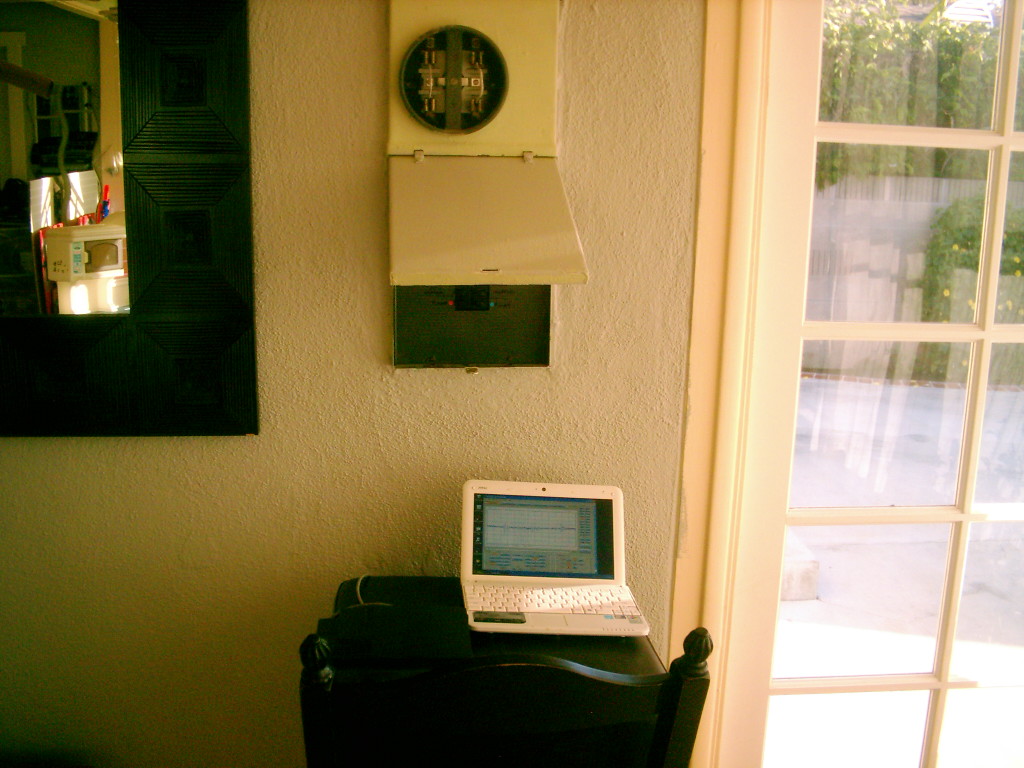
Here is the oscilloscope held next to the empty meter base, showing the presence of the voltage harmonics even with the smart meter removed:
The following is the waveform tracing seen in the photo, at 0.2 milliSeconds per division. The voltage size is 0.6 Volts:
The following is the same waveform tracing at 0.5 milliSeconds per division, again with the smart meter out:
Compare that to the waveform tracing at 0.5 milliSeconds per division before the smart meter was removed, at a time when we thought the voltage harmonics were coming directly from this Itron smart meter. Notice that the waveform and voltage spike above are virtually identical to when the smart meter is removed, shown below:
This proves that the same voltage harmonics were still present on the power company’s incoming electricity with the smart meter removed, indicating the harmonics were from some source of dirty power in a neighbor’s home and not from the Itron smart meter in the home I was measuring.
For the sake of completeness, below is a spectrum analysis of the circuit beneath the panel up to 120 Hz:
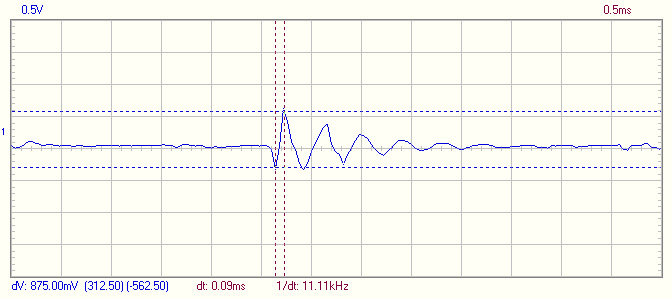
I also measured the presence of the voltage harmonics on the 60 Hz sine wave while standing outside on a step ladder halfway between the house and the transformer on a utility pole. I used a telescopic antenna attached directly to the oscilloscope input and held within one inch of the insulated phase conductors of the utitility service drop. Since the Stetzer attenuator was not in place and we were measuring frequencies through the air with an antenna, the tracing shows the characteristic 60 Hz sine waveform. Notice a spike on virtually every positive and negative peak:
Conclusion and Open Questions
I originally concluded that if the voltage harmonics were from a source within the home under study, they could only be from the smart meter, because every other circuit was turned off and nothing else was plugged into the circuit that my oscilloscope was plugged into. Removing the smart meter proved that they were from some other source, in this case outside the home being studied.
The fact that in each of the seven homes with Itron or Trilliant smart meters, no voltage harmonics have been found to be attributable so far to the smart meter alone, leads to the conclusion that the statement by engineer Tom Wilson that not all smart meters emit voltage harmonics is true. This potentially means that harmonics measured on circuits in homes with particular brands of smart meters in Northern California and elsewhere must be specific to those brands and are not consistently present with every other brand, at least not so far with Itron Openway or GE/Trilliant smart meters used by utilities in Southern California.
Could the harmonics measured in Orange be from an Itron Openway smart meter on some other home? It is known that harmonics of dirty power can travel from one home to others sharing the same utility step down transformer, as is even demonstrated right in this home in Orange. The engineers in Northern California have proven that voltage harmonics from one smart meter do show up on the circuits in neighboring homes, including those that have had their smart meter replaced with an analog one but the homeowner is still symptomatic.
However, if it was the case that the harmonics that I observed in Orange, which are characteristic of a switched mode power supply, are indeed coming from Itron smart meters on neighboring homes, then why not also from the one I directly measured in the home I was in, and why have I not found harmonics of that size at four other homes I have measured thus far also with Itron smart meters with and without loads on?
I present new information in my smart meter article that can explain why people in Southern California, whether previously electrically-sensitive or not, are reacting to smart meters when many could tolerate other sources of radio frequency before, even if dirty power is not the cause.
This new information documents that the power density of radio frequency (RF) transmission from smart meters is much higher at the time of the sending of data than measured when only the synchronous RF transmissions are sent at other times throughout the day and night.
This new information, plus a recognition of the harmful effect on human health from the uniquely short and sharp nature of radio frequencies being emitted by smart meters compared to the more continuous RF transmission from commonly used wireless devices, such as cordless telephones, could explain why some people are particularly bothered by smart meters even with the growing likelihood that the smart meter brands used, at least in this area, do not seem to be emitting harmful voltage harmonics.
We may therefore be able to consider ruling out this one type of EMF, that is, voltage harmonics, as a cause of people’s symptoms from the brands of smart meters used in Southern California while we continue our efforts to recommend opting out and eventually banning smart meters altogther. That is necessary because of the harm they cause from the short, sharp, repeated microbursts 24/7 as well as the high RF levels emitted once or twice per day at the time of data transmission. When it comes to radio frequency exposure, it may indeed be the case that power density alone is not the determining factor as to why one wireless device is more or less harmful than another. It has also to do with the biological effects from the sharpness and persistence of the transmission.
I am in contact with engineers in Northern California and throughout the US and Canada who have measured harmonics from SMPSs in smart meters to determine how consistent their findings were (in San Franciso, the same harmonics were seen in every home with a smart meter), how they were able to rule out other sources of voltage harmonics, and to see more examples of waveform tracings showing the harmonics they repeatedly observed.
I have also asked these and other engineers to review and critique my sampling protocol and calculations to make sure they are accurate and that I am coming to the right conclusions.
I will also continue to test for these harmonics in my EMF evaluations, and I will be returning to homes with analog meters I have already been to to re-measure for the presence of voltage harmonics in the digital RF-off meters being installed now in Glendale and soon in Burbank. I will post my results in a future update.
Images of Previous Waveform Tracings in Orange, and Waveform Tracings from other Homes with Itron and Trilliant Smart Meters
The original waveform tracings from the home in Orange with the Itron Openway smart meter are shown below, followed by tracings from other homes. The Stetzer attenuator removes the 60 Hz sine wave pattern in the tracings but shows frequencies above and below 60 Hz:
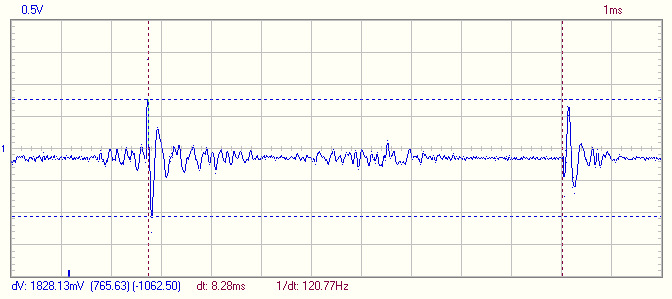
The first two images show the presence of voltage harmonics (now known to come from a source outside the house and not from the Itron smart meter). Both are taken at an outlet located under the main breaker panel with only that circuit switched on (Note: each division is 5 milliSeconds wide):
These harmonics occur on every peak of the 60 Hz sine wave, at +/-60 Hz (thus at 120 Hz). This is, as Rob States observes, possibly indicative of a switched mode power supply (each division is 1 millisecond wide):
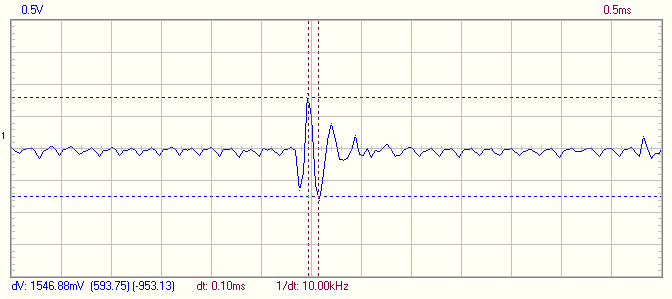
One image below shows these voltage harmonics to have a fundamental frequency of 5kHz. There is a transient of 1.5 Volts in 100 microseconds, for a slew of 15,000 Volts/second:
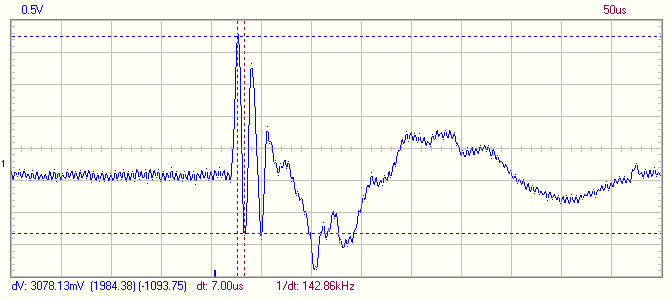
A second tracing shows voltage transients of 3.1 Volts in 7 microseconds, for a very high slew of 439,700 Volts/second. These waveforms showed the harmonics to have a fundamental frequency of 71kHz:
These voltage harmonics are attenuated by the insertion of a single Greenwave filter into the same outlet the Stetzer attenuator and probe were plugged into. Here is the tracing before insertion of the filter:
Here is the waveform after insertion of a single Greenwave filter, showing the attenuation, or lessening of the height of voltage harmonics from 2.2 down to 0.87 Volts, as well as a clearing of the low-level, background noise on the line:
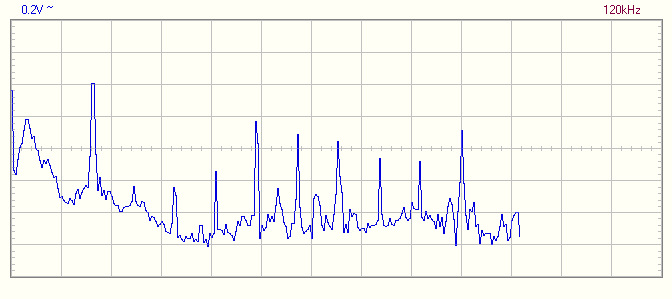
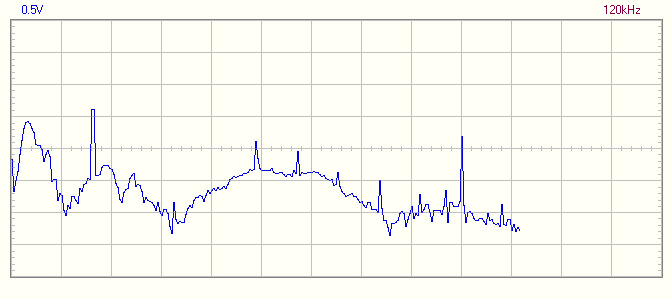
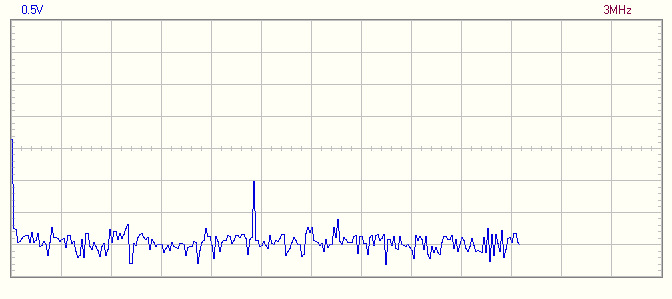
With the understanding from some engineers that spectrum analysis is the most valid way to identify voltage harmonics, I also obtained spectrum analysis of the voltage on the circuits, showing activity in the 120 kHz and 3 MHz range. This activity significantly lessen with insertion of a single Greenwave filter.
Below is a spectrum analysis of the waveform from the panel outlet from 0 to 120 kHz without a Greenwave filter (each division is 12kHz wide):
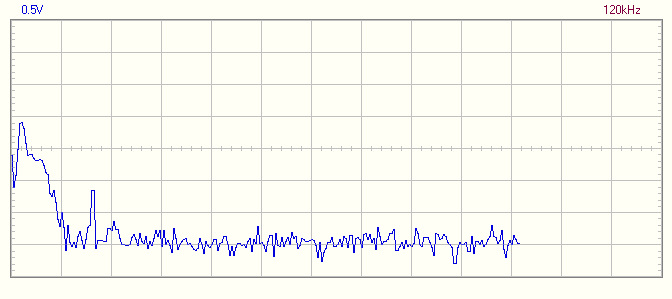
Here is the same analysis with a single Greenwave filter inserted, showing a clearing of the noise at many frequencies:
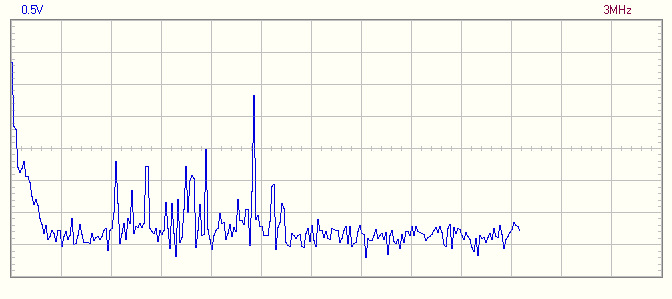
Here is the waveform from 0 to 3MHz without a Greenwave filter (each division is 300kHz wide):
Here is the same analysis with a single Greenwave filter inserted, again showing significant clearing of most noise except for one spike at approximately 1.4MHz:
Waveform Tracings at Additional Homes with Smart Meters
What follows are waveform tracings at other homes with Itron and Trilliant smart meters, some of which also show voltage harmonics, that were, in each case, found to be from some other source. One of these homeowners, nonetheless, is symptomatic from his smart meter, most likely from the radio frequencies (RF).
That assessment was conducted on May 25, 2012 at his home in Tustin, California in the SCE service area with an Itron Openway smart meter. The homeowner has symptoms from EMF sources, including insomnia, that worsened four months after the installatin of a smart meter in October of 2011. He recently stated, “On bad days I am extremely fatigued and generally this is when I was awakened about 2:30 AM. It is not uncommon for me to wake feeling very irritable with a pounding chest.” This would correlate somewhat with the reported time of data transmission of the smart meter located 10-12 feet from his bed on the outside wall of his bedroom, with RF levels found to be higher than at other times during the day.
In fact, Southern California Edison schedules the transmission of data from its smart meters through its mesh network once a day at 12:00 AM midnight. Another building biologist in Southern California, Peter Sierck of Encinitas, is beginning to establish that there is a significantly higher power flux density transmitted by a smart meter at the time it is programmed to transmit its data than he measured when it sends out its microbursts of RF several times per minute to “synchronize the network” throughtout the day and night.
Peter’s findings were obtained using a Gigahertz Solutions HF59B RF analyzer connected to a data logger that monitored the strength of radio frequency transmissions by the smart meter over 24 hours. Peter reportedly found high peaks of radio frequency transmission at roughly 11 AM and 4 PM, the same times that San Diego Gas & Electric schedules its Itron smart meters to transmit their data. A follow-up study at another home in the SDG&E service area again showed high harmonics but in this case at five different times throughout the 24 hour period at roughly 11:30PM, 2AM, 4AM, and two harmonics just before 3 PM.
At the home in Tustin, in an effort to rule out artifacts from any other sources, I measured for voltage harmonics at the breaker panel, shutting off every other circuit in the house. Here are photos of the test on phase A and phase B, with waveform tracings taken on wires coming directly out of the breaker panel, bypassing all circuits in the house:
In this last photo, the oscilloscope and Stetzer attenuator are both on the left:
Below are images showing waveform tracings from both phases of the utility service drop measured at the panel. The first is from phase A:
This next tracing is from phase B:
Neither of these tracings shows any significant voltage harmonics in the path of incoming electric power right after the Itron smart meter.
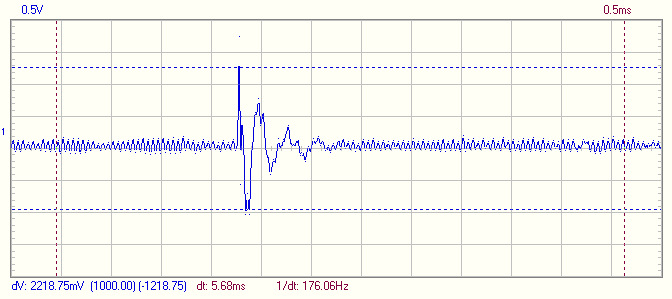
Here is a tracing taken one week earlier at the same home in Tustin on a circuit in the master bedroom, just inside where the smart meter is located, showing large harmonics that were initially thought to be from the Itron smart meter. However, it was later discovered that a touch lamp in another room was plugged into the same circuit and was on at the time of the tracing (each division is 5 milliseconds wide):
These harmonics had a primary frequency of 15.6kHz. The voltage transient was 2.72 Volts in 30 microseconds for a slew of 90,670 Volts/second. This had the same short duration, sharpness and similar frequency as the harmonics reported with the Landis Gyr meters in Northern California. A sample spike looked as follows:
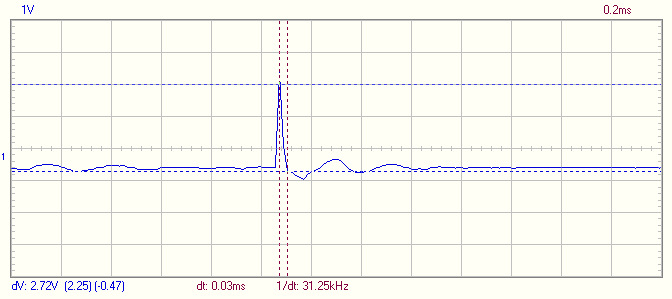
Here is a tracing taken at the same circuit back on May 25th again in the master bedroom, this time with the touch lamp turned off. Compare this to the tracing before the last one, where each division is 5 milliseconds wide and each division is 0.5 Volts high. The large harmonics have disappeared and are therefore not from the Itron smart meter:
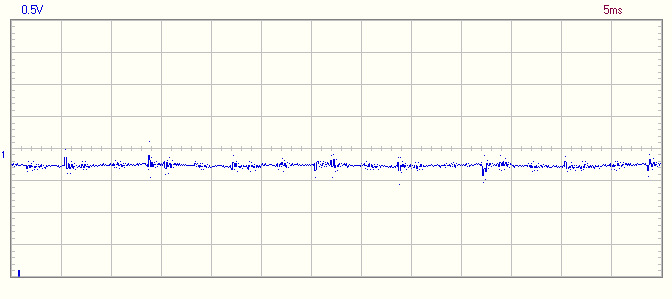
Here is a tracing taken at the same location with the touch lamp turned off but othewise normal loads on in the house, again showing no harmonics of significance (each division is 5 milliseconds wide):
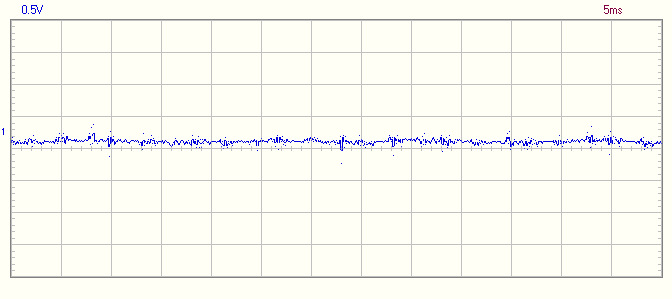
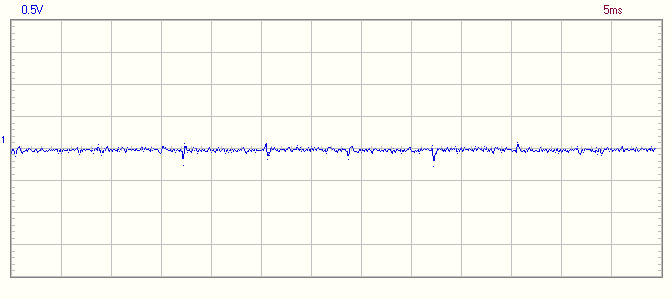
The next tracing was taken on May 29, 2012 at a home in Glendale in the Glendale Water and Power service area with an Itron Openway smart meter. All other circuits were left on. The homeowner is not symptomatic from EMF sources. There are no apparent voltage harmonics similar to those noted in Northern California (each division is 5 milliseconds wide):
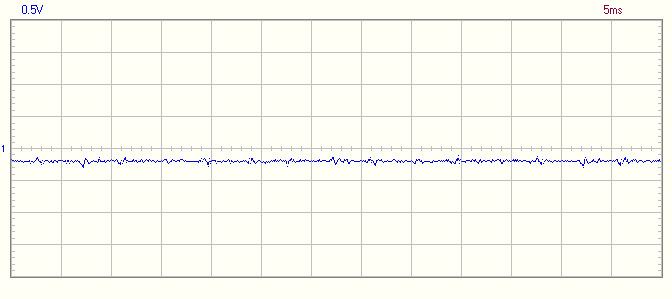
The next tracing was taken on May 22, 2012 at another home in Glendale in the Glendale Water and Power service area with an Itron Openway smart meter. All other circuits were left on. The homeowner is not symptomatic from EMF sources. Again, there are no apparent voltage harmonics similar to those noted in Northern California (each division is 5 milliseconds wide):
The next tracing was taken on May 29, 2012 at a third home in Glendale in the Glendale Water and Power service area with an Itron Openway smart meter. All other circuits were left on. The homeowner is not symptomatic from EMF sources. Again, there are no apparent voltage harmonics similar to those noted in Northern California (each division is 5 milliseconds wide):
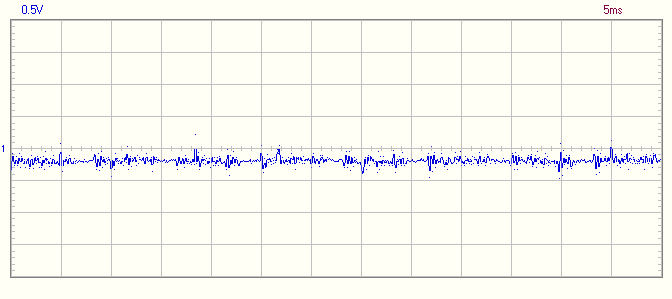
The next tracing was taken on May 17, 2012 at a home in Burbank in the Burbank Water and Power service area with a GE / Trilliant smart meter. All other circuits were left on. The homeowner is not symptomatic from EMF sources. Notice the voltage harmonics, as high as roughly 2 Volts, that I first thought were possibly produced by the Trillaint smart meter. What I did not know until the following week was that a dimmer switch was on in an adjacent room (each division is 2 milliseconds wide):
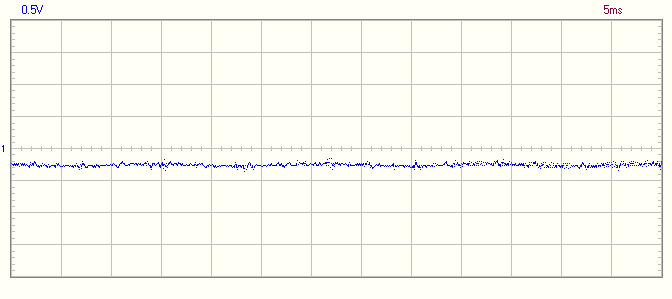
The next tracing was taken the following week at the same home in Burbank when I returned and discovered the dimmer switch. This tracing shows the disappearance of the voltage harmonics with the dimmer switch turned off (each division is 5 milliseconds wide):
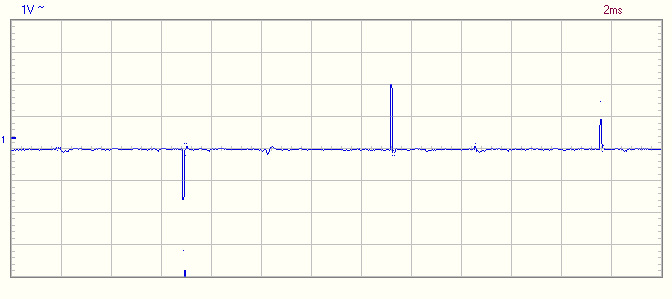
The next tracing was taken on May 17, 2012 at a second home in Burbank in the Burbank Water and Power service area with a Trilliant smart meter. All other circuits were left on. The homeowner is not symptomatic from EMF sources (each division is 2 milliseconds wide):
The second tracing was taken on May 17, 2012 at the same home in Burbank, however on a different circuit than the first one shown above. All other circuits were left on. You will notice the presence of one spike of roughly 1.6 Volts in height, however, it does not appear at the regular periodicity (once every 120 Hz) you would expect from a switched mode power supply. Also, at this house, I did not have the time to shut off circuits or fluorescent lights, or unplug appliances to try to isolate this effect:
BBEC, EMRS, Certified Building Biology™ Environmental Consultant and Electromagnetic Radiation Specialist and Healthy New Building and Remodeling Consultant. Providing On-Site EMF Evaluations for Existing and New Homes and Offices in Los Angeles, Orange, Ventura, Riverside and San Diego Counties and Nationwide by Telephone and Skype. Based upon the principles of Building Biology™.