Spectrum Analysis and Oscilloscope Tracings of Harmonics from Photovoltaic (PV) Grid-Tied Inverters
To see how dirty electricity and photovoltaic (PV) inverters relates to the issue of dirty electricity from smart meters, click here.
Introduction
The following are spectrum analysis and oscilloscope tracings obtained at clients’ homes for the purposes of measuring dirty electricity (DE), or harmonic frequencies. Each home had a rooftop photovoltaic (PV) solar panel system with a grid-tied inverter (not micro-inverters underneath each panel).
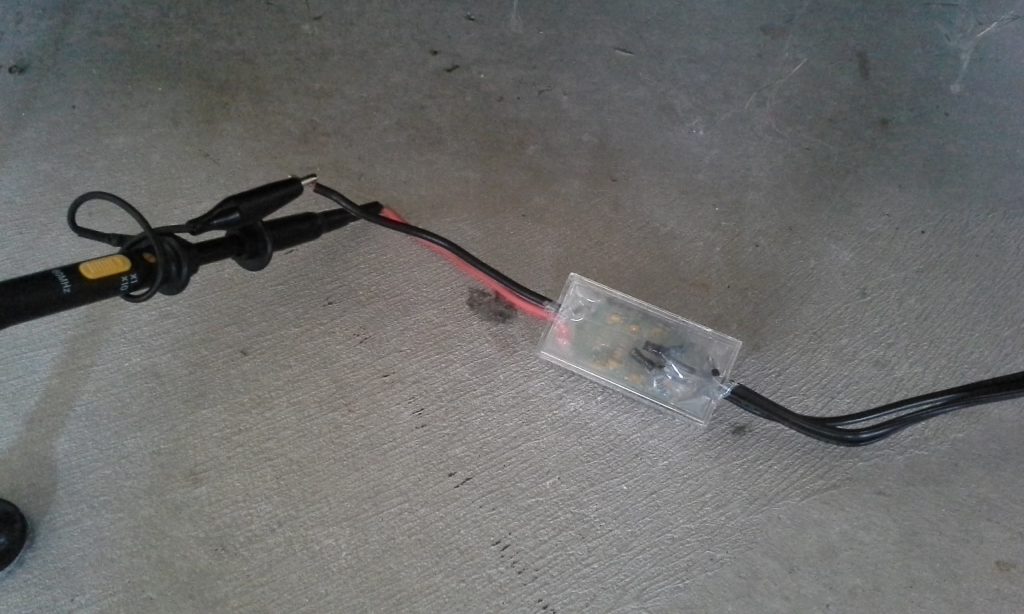
The tracings on the pages below are a spectrum analysis and oscilloscope tracings of a circuit close to the main breaker panel and inverter in each house. I used an attenuator plugged into an outlet, provided for $50 by Stetzer Electric:
This allowed me to tap directly into an outlet without damaging the O-scope, which can only handle a maximum of 30 Volts input. The attenuator removed 60 Hz frequencies on the oscilloscope, allowing frequencies below and above 60 Hz to be shown on the tracing (however a whip antenna on a separate channel showed the typical 60 Hz sine wave configuration). The attenuator also reduced the input voltage to less than 1 Volt.
I used a Velleman PCSU1000 Two-channel USB PC Oscilloscope connected to a PC notebook for the display. The laptop was powered by its internal battery, not the inline transformer.
I measured dirty electricity by plugging the Stetzer attenuator into an outlet as close to the main breaker panel and PV inverter as possible. This was usually in the garage.
I first measured frequencies of dirty electricity with the spectrum analyzer, both by plugging into an outlet as well as measuring in the air with a whip antenna.
This was followed by an analysis of the 60 Hz electricity sine wave on the circuit using the Velemann’s oscilloscope.

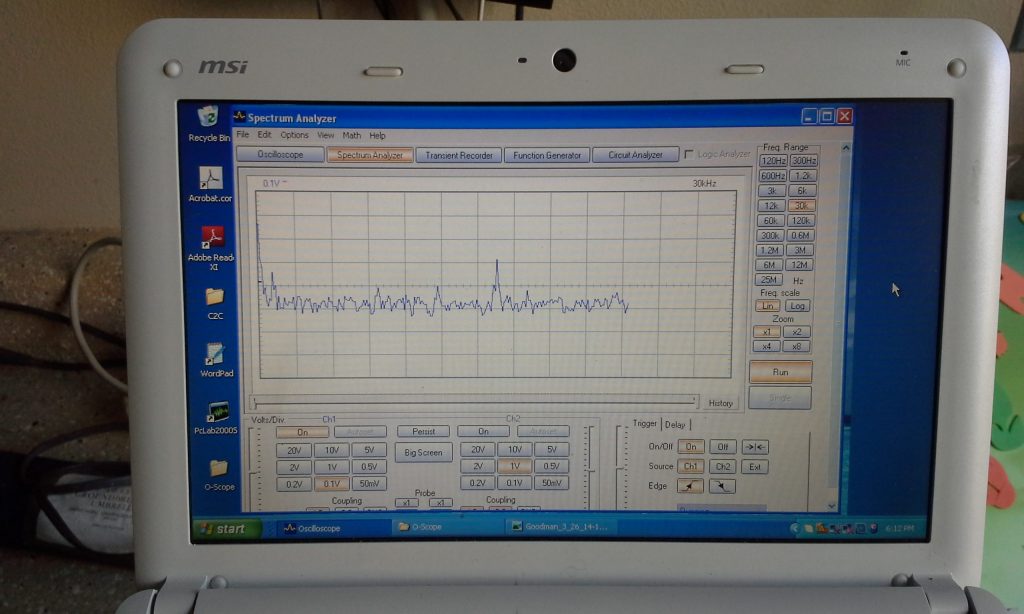
All tracings using a spectrum analyzer below show levels of DE measured in milliVolts (mV), on the vertical axis, relative to frequency, along the horizontal axis.
The frequency shown in the upper right corner of the image is the maximum value of the range being shown. For instance, the number 120 kHz is displayed in this case. That means the tracing shows all activity being measured on the circuit from 0 Hz on the left, to 120 kHz at the right end of the tracing on the display:
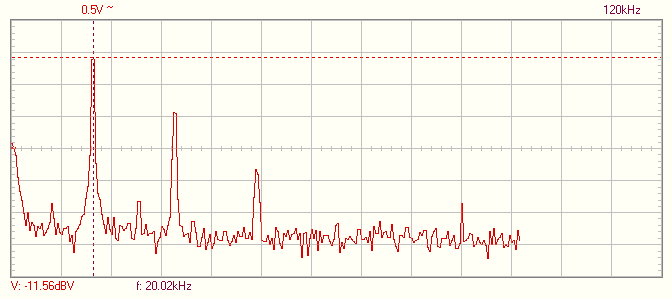
There are ten divisions along the horizontal axis from left to right, meaning each division measures 1/10th of the total range. Thus in this case, each division would display 12 kHz increments as you move from left to right.
You can thereby determine the frequency of any spike by counting the divisions from the left and multiplying that number by the frequencies per division. A spike of 20 kHz, which is the first large spike on the tracing above, would therefore be located just less than two divisions from the left margin in the case of a 0-120kHz range (1.7 divisions X 12 kHz per division), and just under four divisions in the 0-60 kHz range (as shown in a tracing below).
Using markers on the display, you can also determine the frequency by looking at the number that appears along the bottom of the tracing for the location that the dotted line is placed upon. In the tracing above, notice that the vertical marker is lined up with the first large spike on the left, corresponding with a frequency reading of 20.02 kHz displayed at the bottom of the tracing.
This first large spike is the fundamental frequency of a source of dirty electricity, which in this case, is the photovoltaic inverter. If you then count the divisions, you can see harmonics at the expected frequencies (multiples of the fundamental frequency), but with lower voltages (heights). These are at 40 kHz, 60 kHz, and so on.
The vertical axis, along the left margin of each tracing, shows the strength of each spike measured in Volts (V). The number at the top left shows the number of Volts per vertical division, which in all cases is 0.5V, or one-half of one Volt.
When I lined the vertical marker with the top of the first (fundamental frequency) spike, you see the strength or height of that spike recorded at the lower left margin in decibel Volts (dBV), which is -11.56 dbVolts in this case.
I noted that when the inverters were turned off, in each case the fundamental frequency and its harmonics completely vanished. See below.
Home in Trabuco Canyon, Orange County, California
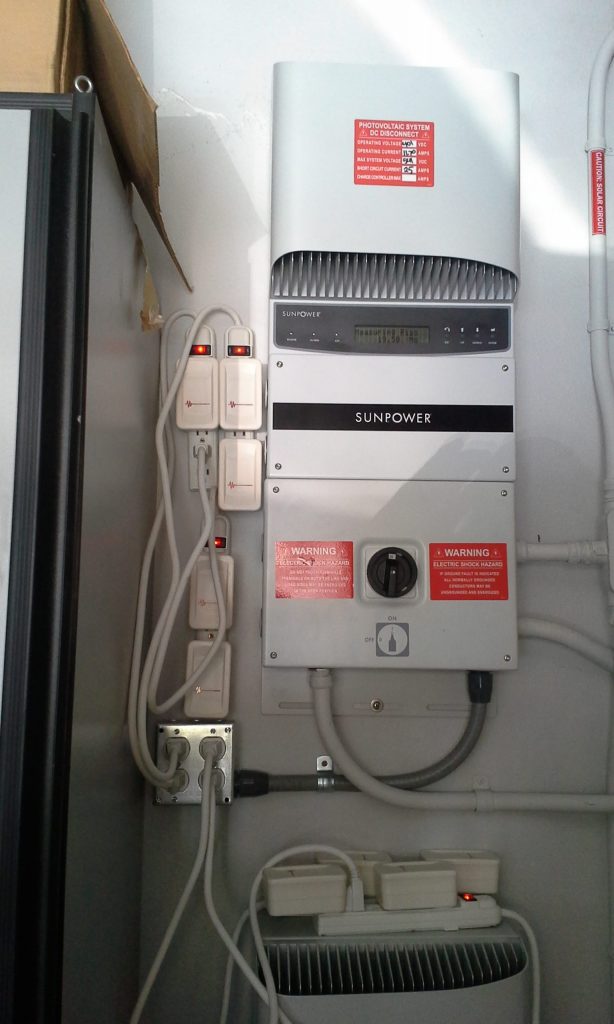
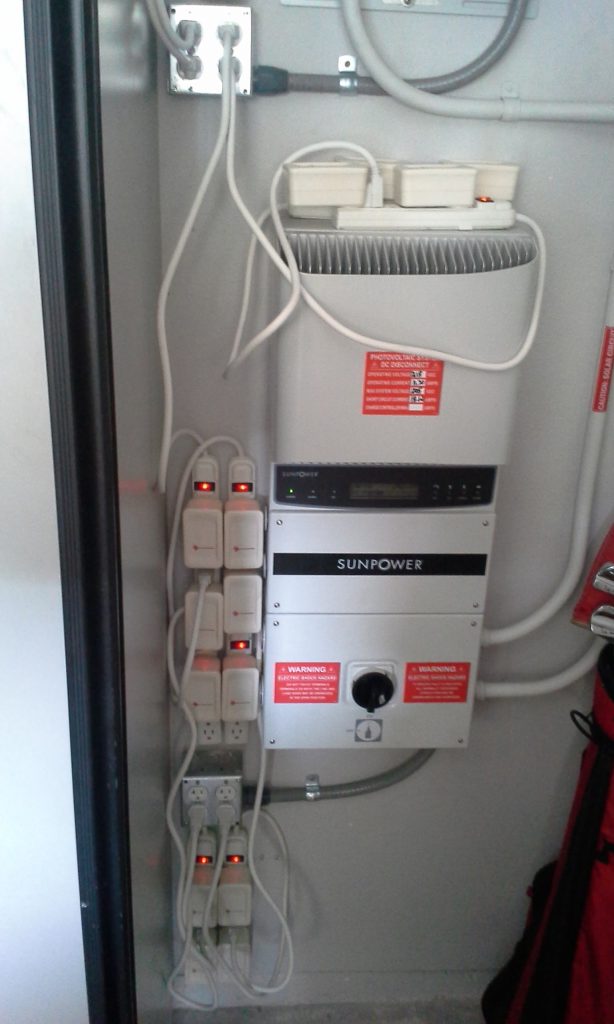
The first home was measured on 4/17/14. It has two Sunpower brand grid-tied inverters, mounted one above the other in the garage (and, yes, those are numerous Stetzer filters plugged in all around these inverters, in the homeowner’s attempts to reduce the DE that bothers him to a great extent):
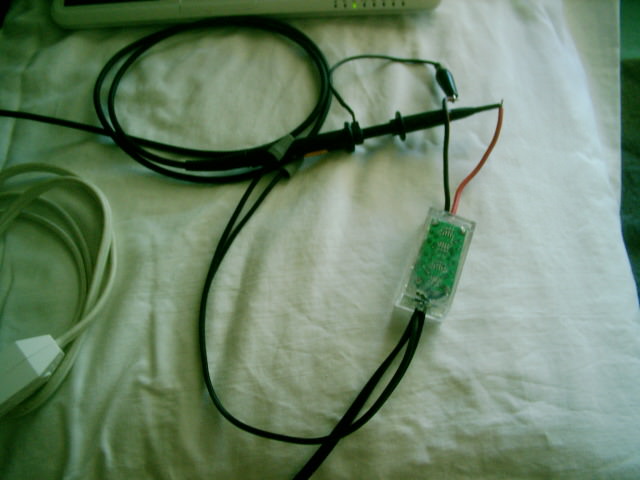
Here are photos of the oscilloscope set up. In the first photo, you see the Velleman scope with a whip antenna connected to channel A, while a wired lead from the circuit is connected to channel B. A close-up is shown in the second photo:
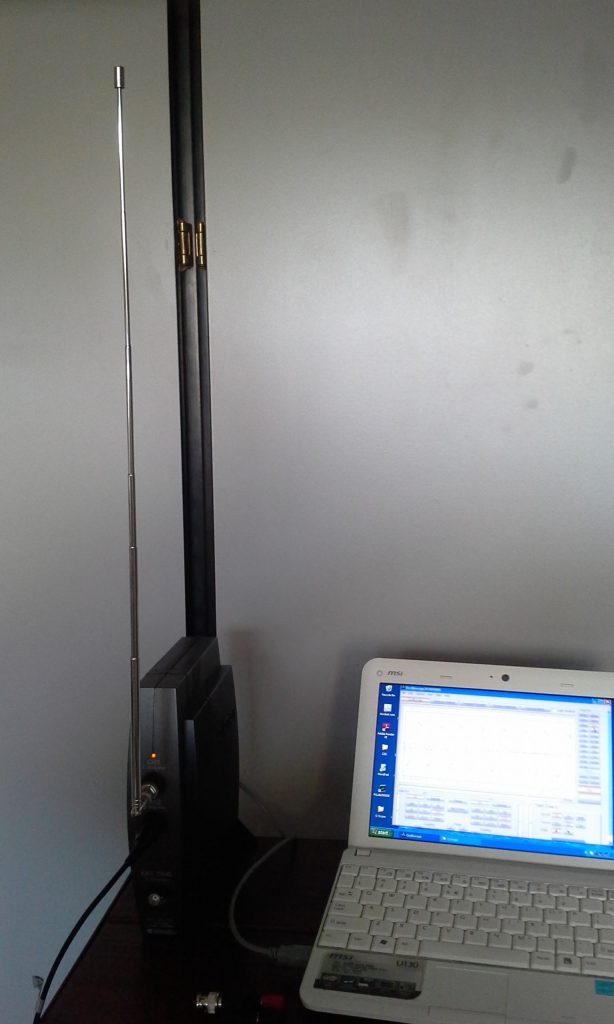
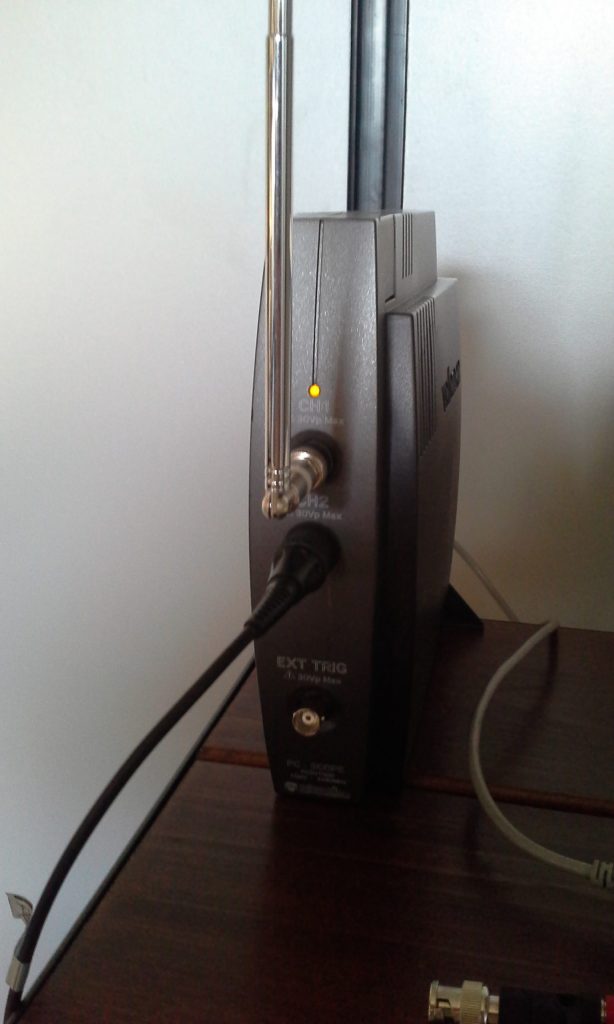
The wired lead is connected to the two wires of the Stetzer attenuator, which is plugged into an outlet:
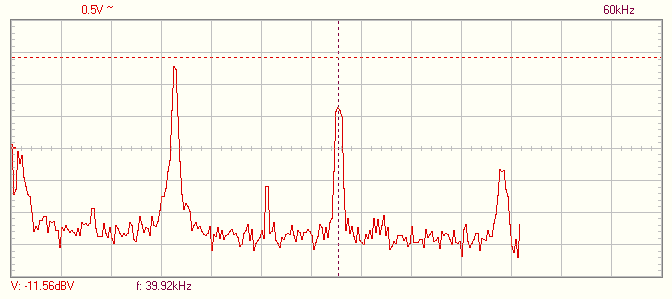
In the first tracing below, you see a fundamental frequency at 20 kHz with a height of -11.56 dB. You can count the height of the spike above the baseline by noting that each vertical division is 0.5 Volts and the peak is roughly 5.5 divisions above the baseline. Thus 0.5 Volts/division X 5.5 divisions correlates with roughly 2.75 Volts of height, equal to -11.56 dBV.
Notice also the harmonics at 40 kHz and 60 kHz to the right, each one with diminishing intensity or strength (height):

Below you will see the reading at closer range (0-60 kHz), meaning the range from left to right is from 0 to 60 kHz rather than from 0 to 120 kHz, and each division measures 6 kHz in width instead of 12 kHz.
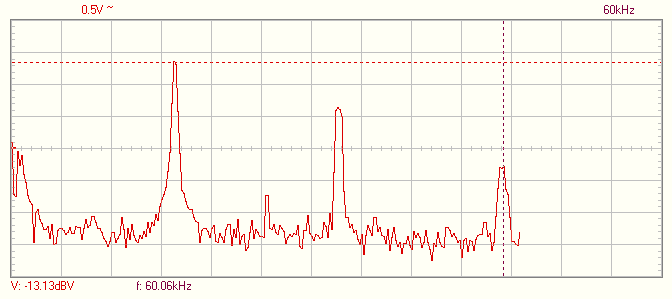
I happen to have placed the marker over the third harmonic, which registers at the bottom as 60kHz. The height of the fundamental frequency on the left at 20 kHz is roughly the same as in the tracing above (-13.1 dBV vs. -11.6 dBV):
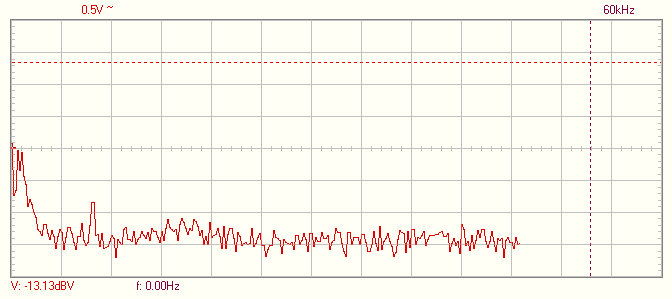
Now I show you a tracing at the same range of 0-60 kHz but with the PV system inverter turned off. Notice that the fundamental frequency and its harmonics are completely gone:
Next is a depiction of the reduction of DE with the inverter on but with all the Stetzer filters shown in the photos above in place. I first show a tracing with the surge protectors into which the Stetzer filters are plugged switched off, as a baseline. Notice, again, the height of the fundamental frequency (at 20 kHz) is -13.13 dBV, shown in the lower left margin (5.5 divisions above the baseline, corresponding to 2.75 V high):
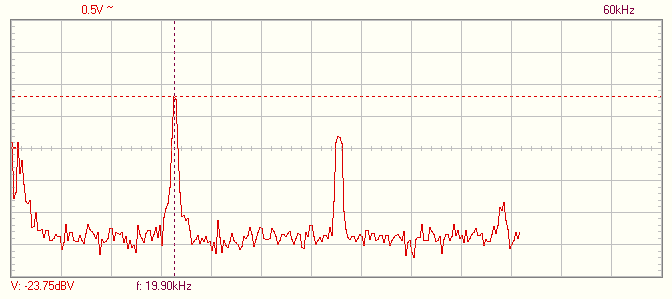
Next is a tracing with the surge protectors switched on, powering the Stetzer filters. Notice that the height of the fundamental frequency at 20 kHz has dropped from -13.1 dBV to -23.75 dBV (the more negative the dBV value, the lower the Voltage or height of the spike). This is shown in the lower left margin. With Stetzer filters on, the new height is 4.2 divisions above baseline, or 2.1 V, compared to 5.5 divisions above baseline with Stetzers off, at 2.75 V.
This represents a 25% reduction. The spikes for the first and second harmonics are also smaller than in the tracing above:
You can likewise see a change in the amount of distortion of the electric utility’s 60 Hz sine wave on an oscilloscope tracing with the inverter turned on compared to shutting it off (and also comparing to having Stetzers switched off).
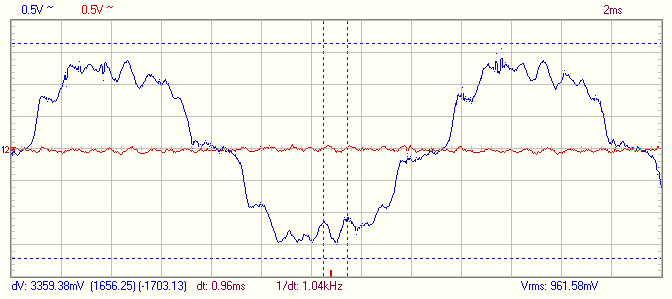
The first oscilloscope tracing below is with the inverters shut off. The red tracing (channel B) is taken directly from the circuit, as are the spectrum analyzer tracings shown above (remember, the Stetzer attenuator cuts out the 60 Hz sine wave, resulting in a flat oscilloscope tracing if no higher frequencies are present).
The blue tracing (channel A) is from a whip antenna, which measures any DE in the air (and shows a true 60 Hz sine wave because there is no attenuator on the lead from the whip antenna, only on the lead from the electric circuit). There is some amount of harmonic frequencies (DE) in the air (at 1.06 kHz), which is not from the inverter (remember, it was turned off at this point). The blue sine wave is not completely clean, but this particular amount of DE, from some other source, is not of a significant amount:
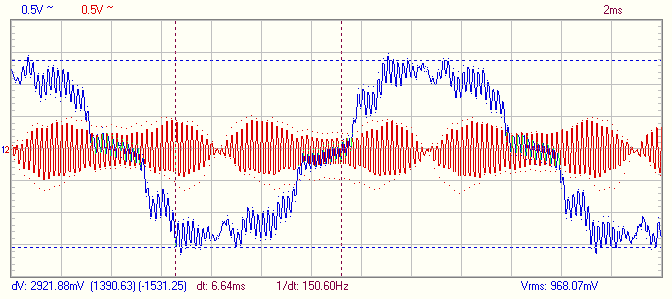
Compare this relatively clean oscilloscope tracing to the tracing below, this time with the inverters turned on. A higher frequency is superimposed upon the 60 Hz sine wave, as seen on both channel B connected to the circuit (red) and on channel A connected to the whip antenna in the air (blue):
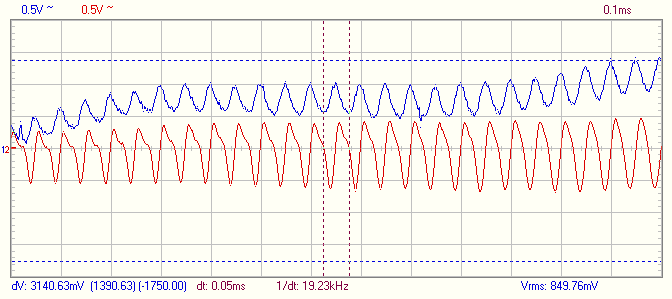
Here is a close up of the same tracing with the horizontal divisions now at 0.1 milliseconds (ms) rather than 2 ms, as in the tracings above. We know that this higher frequency superimposed upon the 60 Hz sine wave is from the inverter and that it has a frequency of 20 kHz. You can actually determine this on the oscilloscope by placing the markers at the beginning and end points of any one cycle. The markers below are placed on roughly the zero point of the red tracing (an imaginary horizontal line running through the sine waves). They can be placed anywhere on two sequential oscillations as long as they are on the same point in each cycle.
In the case below, the markers measure 0.05 milliseconds of time (listed at the bottom of the graph as dt, or “delta time,” at 0.05ms). This represents the wavelength, shown as a red number at the bottom margin. You can then calculate the frequency based upon the wavelength, because frequency is inversely related to wavelength, or 1 over delta time (1/dt). The frequency is shown in red on the bottom margin as well. It reads 19.23 kHz, matching the fundamental frequency of roughly 20 kHz seen on the spectrum analysis tracings shown above. Thus you can determine any harmonic frequency of DE using either the spectrum analyzer or the oscilloscope.
Here is the oscilloscope tracing showing the wavelength and frequency of the higher (20 kHz) frequency superimposed upon the 60 Hz sine wave of utility electricity:
Conclusion
You can therefore see from the tracings at this first house that the Sunpower inverters indeed produce a 20 kHz fundamental frequency plus harmonics that totally disappears when the inverters are turned off. (By the way, this disappearance of dirty electricity at 20 kHz occurred with an Itron brand smart meter in place, which is itself supposed to produce dirty electricity according to many sources, but there is none when the inverter is shut off–see below.)
Stetzer microsurge meter readings with the inverters switched on were 1050 to 1350 Graham-Stetzer Units (GSU). With all the Stetzer filters plugged in that you see in the photos above, the reading dropped to 180-240 GSU.
When the inverters were switched off and Stetzer filters were also switched off, the DE reading dropped to only 63 GSU. That is the baseline dirty electricity level at this house.
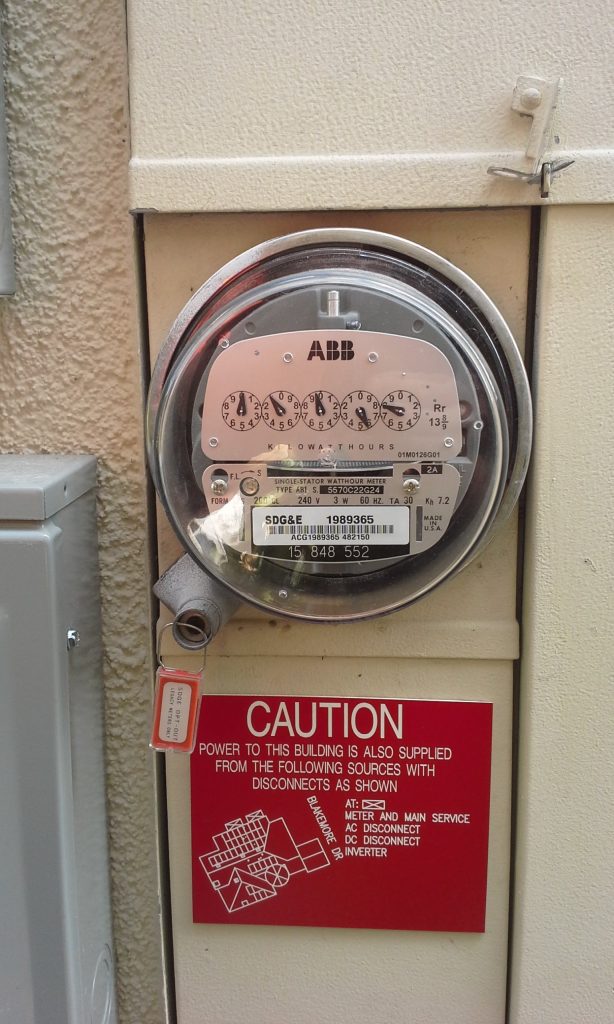
This house has a Southern California Edison Itron brand smart electric meter, as seen in this photo taken by the homeowner (at the bottom of the smart meter are the words, “OpenWay by Itron” and the letters “SCE” stand for Southern California Edison):
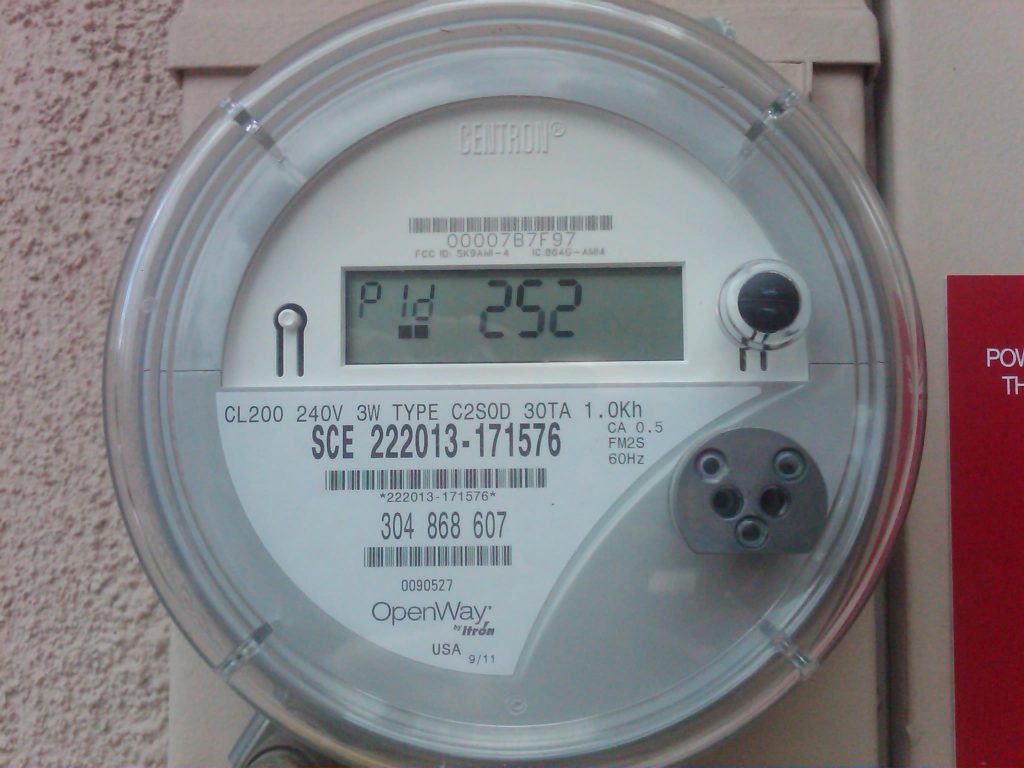
The fact that the spectrum analyzer at this house showed an absence of 20kHz dirty electricity when the inverters were switched off has implications in terms of the question of whether Itron brand smart meters generate dirty electricity or not. That is a separate question from this discussion on dirty electricity and solar panel inverters, but important nonetheless.
As you can see above, our measurements on the spectrum analyzer and oscilloscope show that there is no DE when the device that does produce DE, the Sunpower inverter, is switched off. Yet, we have an Itron smart meter in place. Where is the dirty electricity that this smart meter is supposed to produce? It does not appear to be present, at least not with this particular brand.
See below for a further discussion and analysis of the issue of dirty electricity and Itron brand smart meters.
Home in Ladera Ranch, Orange County, California
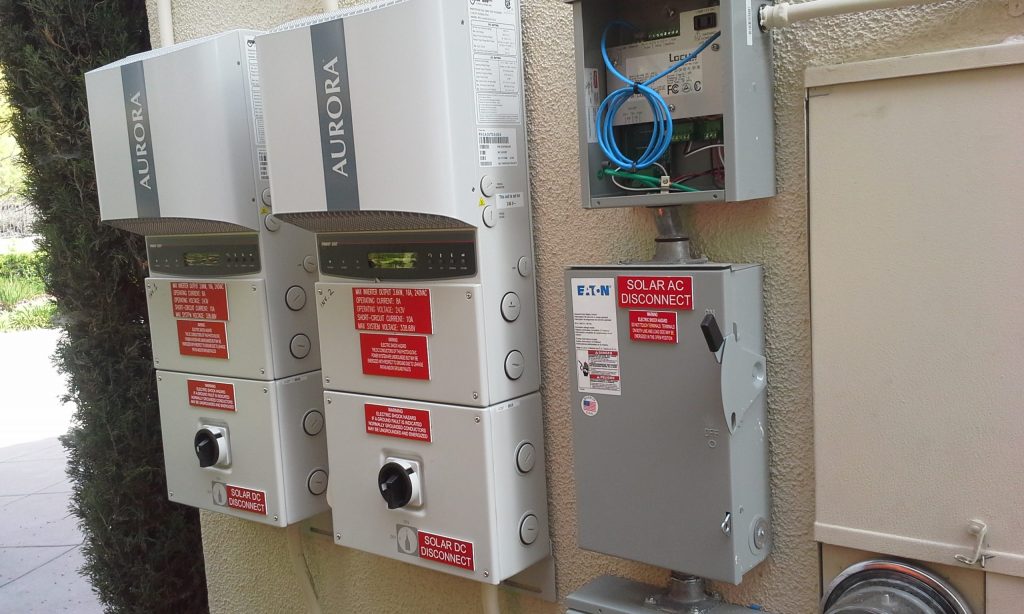
We measured DE at a home on 3/26/14 that also has PV solar panels and two Aurora Power One photovoltaic grid-tied inverters, leased from Verango:
I should mention that Verango agreed to install a non-wireless electric meter to monitor their PV panels, since this is a grid-tied system. Normally Verango uses an electric meter that sends its data intermittently to a local cell tower. Whenever Verengo has a client living in an area with poor cell reception, they use an L-Gate 100 brand electric meter that conveys its data to Verango through the homeowner’s Internet router using an Ethernet cable, not wirelessly to the nearest cell tower.
Here is a photo of the L-Gate non-wireless electric meter used by Verango:
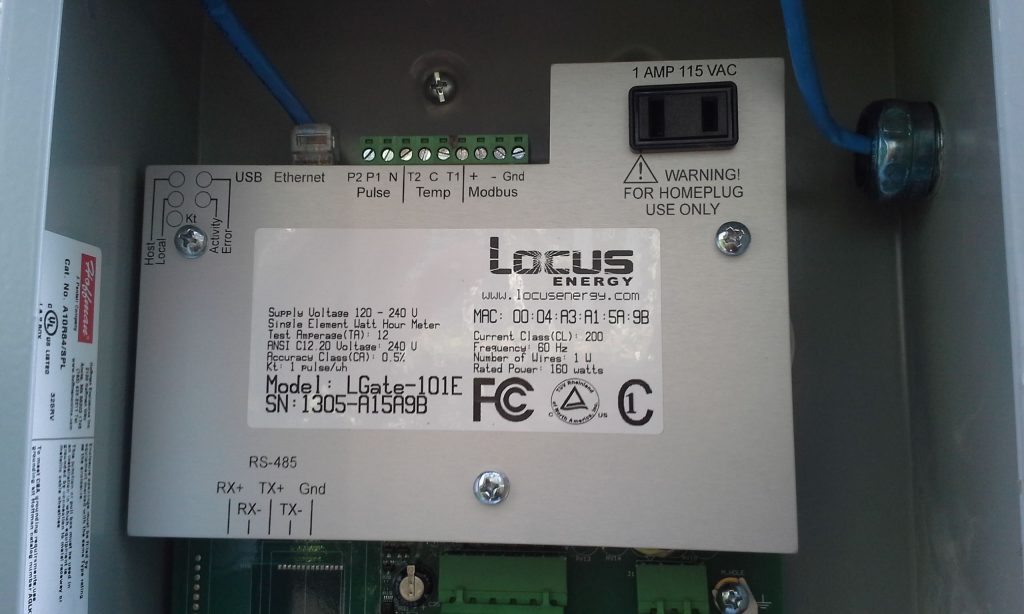
Verengo is also willing to use the L-Gate 100 electric meter for customers who do not want a wireless electric meter.
This client had opted out of San Diego Gas & Electric’s smart meter program and instead had an opt-out analog meter. This resulted in a solar panel set up that was devoid of any wireless transmissions from either Verango’s meter nor from SDG&E’s electric meter:
This is actually a bit unusual in that we are told by certain other electric utilities that they cannot use an analog meter, which is what smart meter opt out customers get, on a house with a grid-tied net metering system with PV panels. Yet San Diego Gas & Electric has just such a set up at this house in Ladera Ranch.
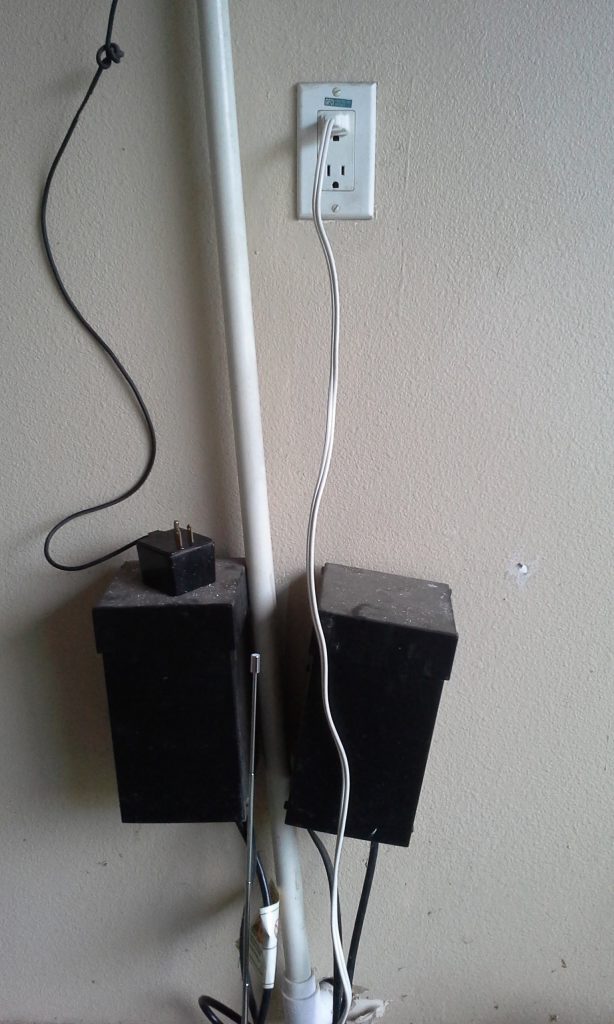
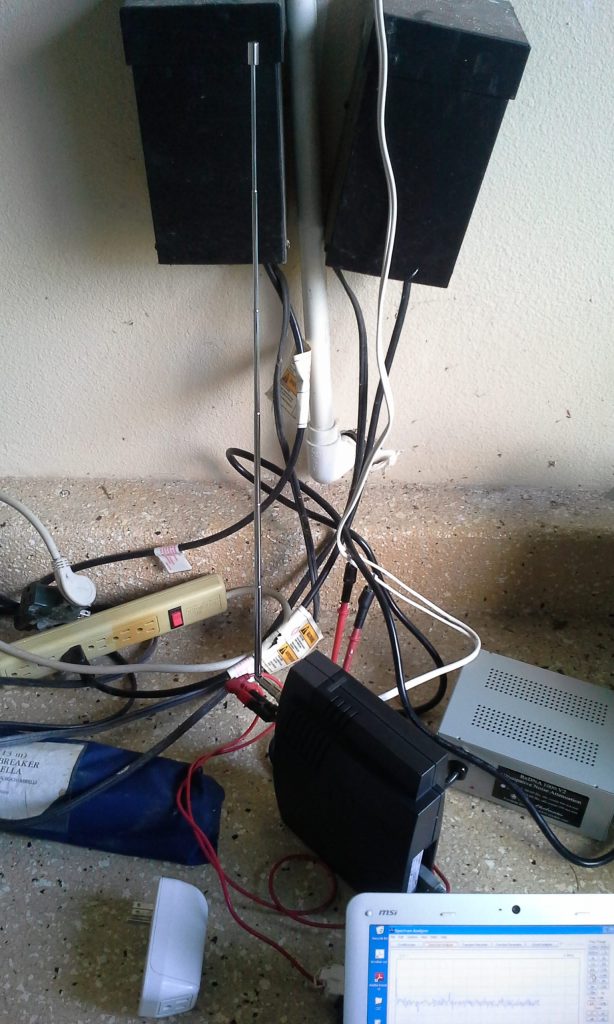
Once again, here is the oscilloscope set up at the home in Ladera Ranch. The Velleman scope was plugged into an outlet in the garage on the opposite side of the wall from the inverters, allowing DE measurements straight off the circuit into channel B. I also had a whip antenna connected to channel A. The power supplies for the two irrigation timer motors in the black boxes mounted on the wall were removed, as they produced extraneous DE, which would have been an artifact on our tracings had I left them plugged in:
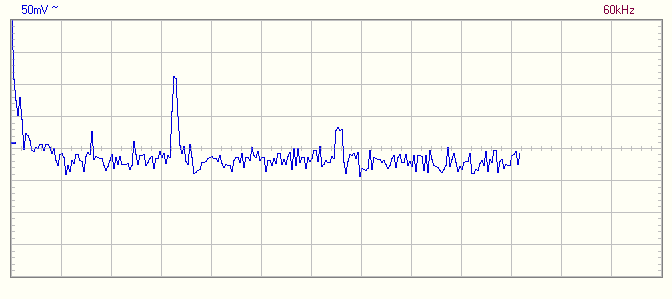
Tracings of the spectrum analysis of this circuit are shown below. The first image shows a spike 3.3 divisions from the left in the 0-60 kHz range. Since each division is 6 kHz wide, 3.3 divisions would equal roughly 20 kHz. Just as with the house in Trabuco Canyon with the Sunpower inverter, this fundamental frequency is also at 20 kHz:
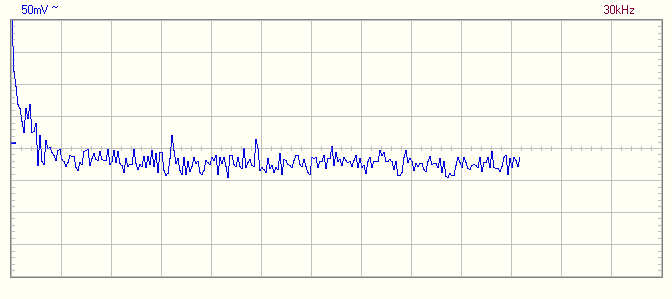
Here the 20 kHz spike is seen again, this time at 6.6 divisions from the left on a tracing with a 0-30 kHz range:

Now see the same tracing but with the inverters switched off. As at the previous house, the spikes are now completely gone:
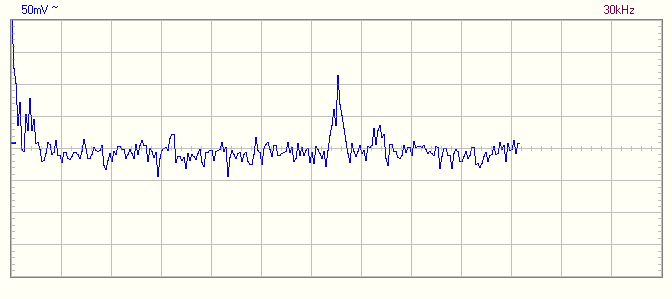
The following tracings show the reduction of DE using DE-reducing devices. First we show you a tracing without devices in place, showing the spike from the Aurora inverters. The spike measures 125mV (2.5 divisions) high:
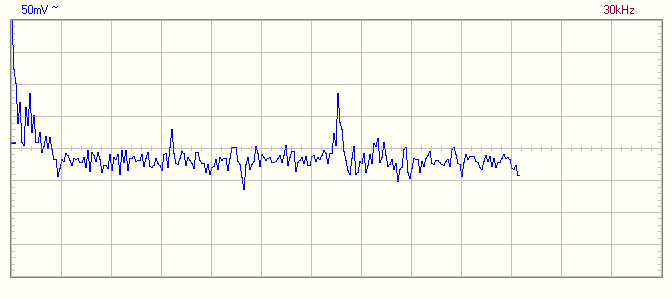
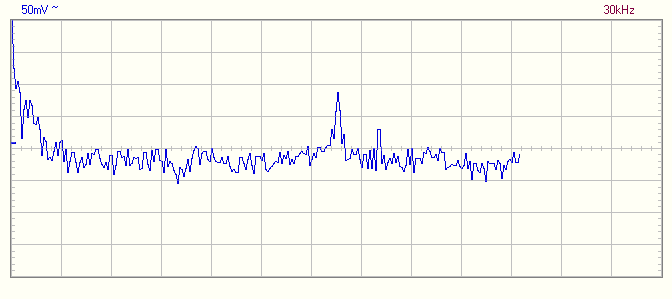
The first photo below shows a Greenwave filter in use. Below that an RxDNA device is in use. In both cases, spikes are 100 mV (2 divisions) high, not 125 mV (2.5 divisions) high, representing a 20% reduction:
Here is a photo of the RxDNA dissipative noise attenuation device:
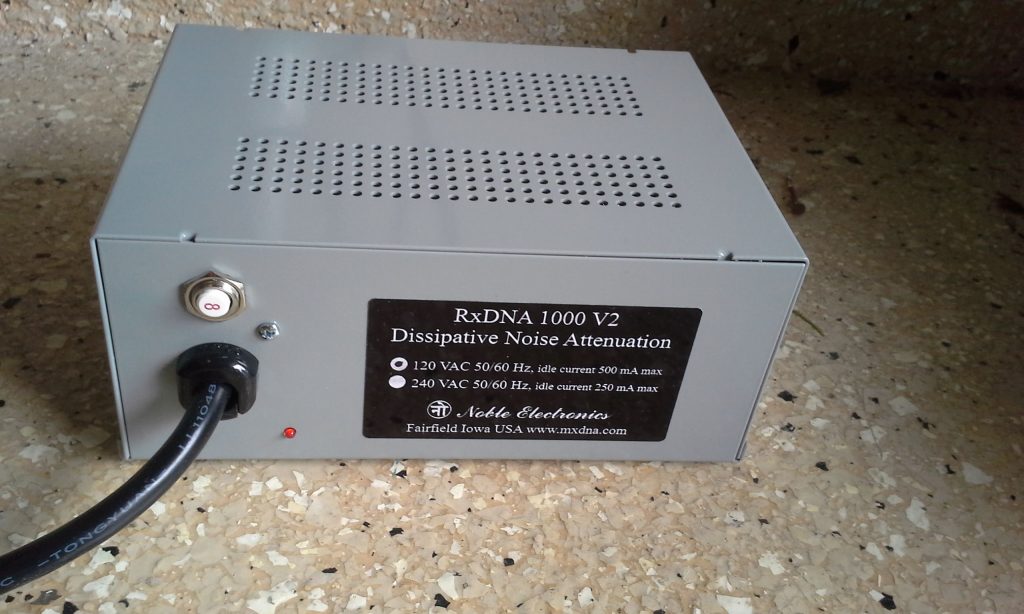
To access the website for the manufacturers of the RxDNA, Robert and Greg Palma, click here.
To access the website of Greenwave, click here.
Dirty electricity readings on the Stetzer microsurge meter at this house were 1000-1800 GSU with the inverters on but without filters or DE-reducing devices in place. Separately inserting a Greenwave filter and the RxDNA both reduced the DE levels to 300-400 GSU. When the inverters were turned off, the DE level dropped to only 68 GSU.
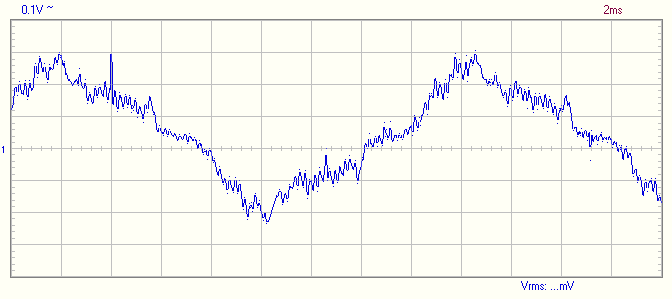
Below you see an oscilloscope tracing of the 60 Hz sine wave captured in the air with a whip antenna comparing inverters switched on versus switching them off.
The first tracing shows a sine wave with the inverters switched on. You will notice a high frequency pattern (20 kHz) superimposed upon the 60 Hz sine wave, appearing as a tiny saw-toothed oscillation overlaid onto the sine wave. Both tracings are at 2ms per horizontal division and 0.1V per vertical division.
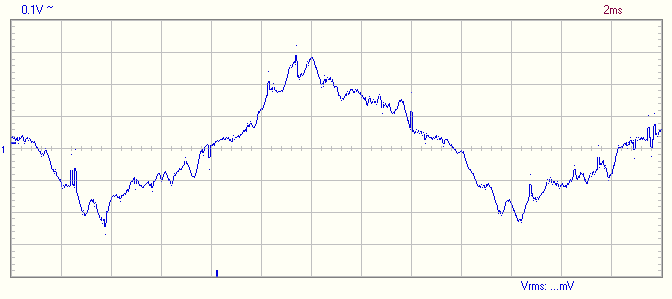
Here is the oscilloscope tracing with the inverter switched off. Notice how much smoother the tracing is, devoid of the saw-toothed higher frequency superimposed upon the 60 Hz sine wave above:
Conclusions on Dirty Electricity from Inverters with PV Systems
These two cases show specific examples of dirty electricity from photovoltaic (PV) solar panel grid-tied inverters. These occurred with both brands of inverter, a Sunpower and an Aurora. The fundamental frequency in both cases was 20 kHz, with accompanying harmonics.
I am also aware that Sunny Boy brand grid-tied and off grid inverters, made in Germany, do not produce dirty electricity (at least when measuring the electric field component produced by Voltage). Reportedly the engineers at Sunny Boy are aware that PV inverters produce dirty electricity. Apparently their company installs filters to prevent these harmonics from spreading onto the electric circuits of the house and to neighbors through the utility grid.
There has been some observation, however, of a 16kHz spike, plus its harmonics, when measuring Sunny Boy inverters with a magnetic coil. This is under further investigation, but may be able to mitigated with some of the dirty electricity dissipating devices available on the market. The bottom line with PV systems is you will have some degree of dirty electricity apparently even with Sunny Boy brand inverters, but it will be less than with other brands, and DE-reducing devices may be helpful in reducing this. We continue to explore this issue.
Do All Smart Electric Meters Emit Dirty Electricity?
Finally, I would like to comment on the topic of dirty electricity and smart meters. While some engineers in San Francisco are reporting the presence of dirty electricity on their spectrum analyzers and oscilloscopes which they believe comes from the smart meter brands (Landis Gyr and GE) used by the electric utility, Pacific Gas & Electric, in their area, I have not found any evidence of dirty electricity from any of the Itron brand smart meters used by electric utilities here in Southern California in my analysis of over 20 Itron smart meters conducted in 2012 (see my Smart Meter Study by clicking here). This needs to be studied further.
However, I have heard certain experts in the field of dirty electricity, whom I respect, make the comment that they are noticing a 20 kHz fundamental frequency (with its attendant harmonics) on their spectrum analyzer in recent years at homes in Southern California, which they attribute to the installation of numerous Itron smart meters by the electric utilities in this part of the state. It is likewise stated by other DE experts outside California that smart meter dirty electricity has a fundamental frequency of 20 kHz.
It is certainly logical to come to this conclusion based upon the coincidence of the appearance of DE at 20 kHz at the same time that electric utilities in Southern California have installed Itron meters on virtually every home in their service area (minus those relatively few customers who have opted out). However, in order to come to the conclusion that the appearance of a 20 kHz spike is solely due to the Itron smart meters, it would be necessary to try to isolate the smart meter as the only source.
I would like to respectfully propose a second (or possibly sole) source for the growing appearance of this 20 kHz harmonic when dirty electricity is measured in homes in Southern California in recent years. That is, the rapid rise in the installation of photovoltaic (PV) solar panel arrays, which has also happened in large numbers in the past two years.
The inverters used in these PV arrays are known to produce a 20 kHz frequency, with its attendant harmonics. We know this because we measure this frequency in homes with PV panels and inverters (except those with Sunny Boy inverters–see above). However, the 20 kHz frequency and its harmonics always disappear when we turn off the inverter.
What is most important relative to the issue of whether Itron brand smart meters produce dirty electricity or not is the fact that the 20 kHz harmonic also disappears at homes with an Itron smart meter in place, as was the case at the home in Trabuco Canyon discussed above.
This finding leads to the conclusion that Itron smart meters do not generate the 20 kHz frequency of dirty electricity seen in recent years on spectrum analyzers, while Aurora, Sunpower and apparently other brands of PV inverters do produce a 20 kHz frequency of dirty electricity, with harmonics.
I am certainly not of the opinion that smart electric meters are in any way safe and I support efforts to work towards their removal from homes and their replacement with analog (non-digital), non-transmitting electric meters not just for those who opt out but for every homeowner and business throughout every electric utility’s service area.
However, in the interest of accuracy, when it comes to the issue of smart meters and dirty electricity, as stated in my smart meter study, accessed by clicking here, I have found that Itron brand smart meters do not generate any dirty electricity (DE), or more accurately, the DE that the switched mode power supply within them does produce is actually filtered.
As I mentioned in that study article, there are reports from two individuals that some smart meter companies, most notably Itron, actually put a filter into their meters for the DE produced by the switched mode power supply that they contain. This power supply is needed to transform 120 Volt electricity down to the low voltages (3-10 Volts) needed by the circuit boards used to monitor the metering of electricity (the so-called metrology circuit board) and to run the radio frequency or power line carrier (PLC) communication module.
Specifically, an engineer client in Thousand Oaks, California remarked to me in July 2013 that he was in possession of an email that said that Itron smart meters are indeed filtered. (When I told him it was very important to me to see that email, he told me it was buried in a batch of emails that was some months old, and I have asked him on two occasions to try to find it, but have not received a response. I do, however, believe that he is stating the truth when he said he had read an email with that information).
Likewise, a smart meter network technician, Tom Wilson of Florida, wrote to me in 2012 that most smart meter manufacturers have foregone the use of filters to reduce the DE produced by their switched mode power supplies in order to save 89 cents per meter (which adds up to a substantial amount of money when you are manufacturing one million smart meters), but that not all manufacturers do that. He said that some manufacturers still filter the switched mode power supplies they install. I am presuming, based upon my study and the comments from the local engineer, that Itron is one of them.
The most important reason why I have come to the conclusion that Itron brand smart meters, at least the models used by electric utilities in Southern California, do not produce dirty electricity is that I have never found any evidence of DE with my oscilloscope and spectrum analyzer that I could attribute solely to be caused by any Itron smart meter. This includes at more than 20 homes that I studied in 2012 where they were installed. I did find DE during the study, but it was always traceable to some other source.
This is now corroborated by the finding at the home in Trabuco Canyon that no significant DE is seen on a spectrum analyzer tracing when an Itron smart meter is present and two Sunpower inverters are switched off. In addition, a Stetzer microsurge meter showed a DE reading of only 63 units with the inverter off but the Itron meter in place, but a reading of 1,000-1,800 units when the inverters were on. (The Stetzer microsurge meter picks up all frequencies in the 10-100 kHz range, so it would pick up any dirty electricity at 20 kHz.)
If the Itron smart meter also produced DE with a fundamental frequency of 20 kHz, this spike and its harmonics would not have disappeared when the inverters were switched off. Furthermore, the Stetzer microsurge meter reading would not have fallen from a high of 1,000-1,800 units with the inverters on to a low of 63 units with the inverters turned off.